
The second week of May was not short of big data news. The US inflation surged to 4.2% in April, the highest since 2008, the UK economy contracted by 6.06% in Q1, and China released its seventh population census, showing that the Chinese population has increased by 5.4% from a decade ago to 1.4bn.
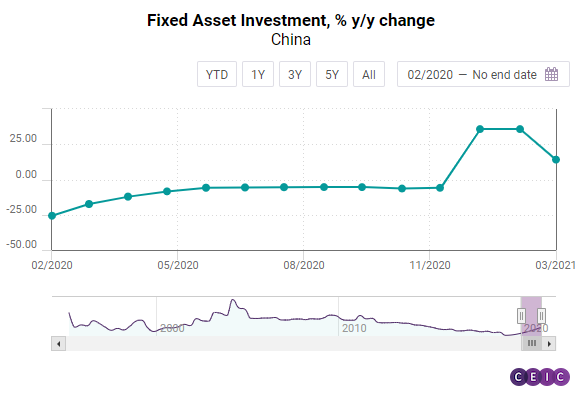
The next week will not be less busy in terms of key data releases. It starts with April economic activity indicators for China, including fixed-asset investment, industrial production, retail sales, unemployment rate, and real estate prices. On the same day, Japan is going to release its Q1 GDP data after the slight deceleration compared to the previous quarter in Q4 2020.
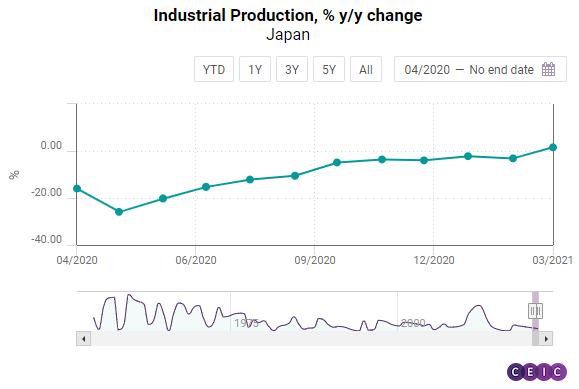
On Tuesday, the UK labour market data for April, the claimant count change, and the unemployment rate, will be released followed by the US building permits and housing unit started for April – some of the major leading indicators for the US economy. On Wednesday, there will be two key data releases for Japan – the April industrial production index and foreign trade data, followed by inflation data for UK and the Euro Area. The US FOMC meeting minutes will also be released on that day.
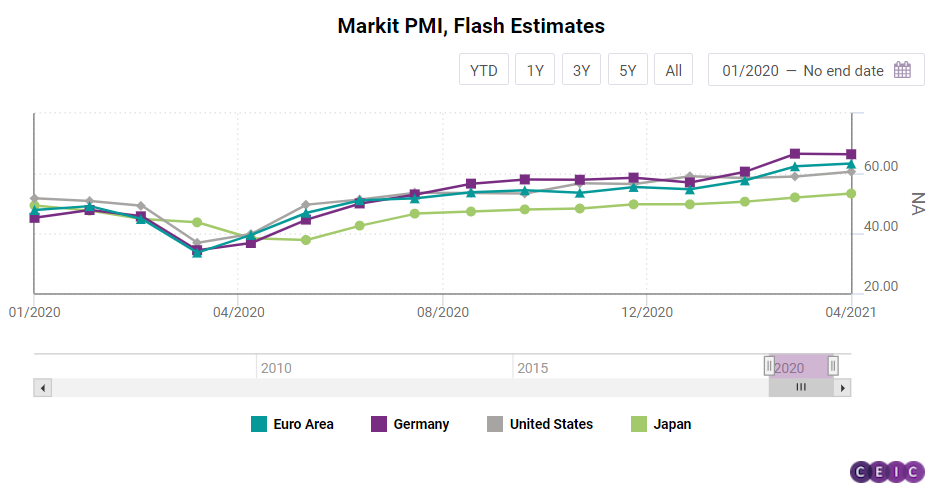
On Thursday, China’s loan prime rate that remains unchanged since April 2020 will be released by the People's Bank of China. Indonesia’s foreign trade data for April will also be published, after the South-Asian country registered trade surplus for 11 months in a row. On the same day, the GfK consumer confidence index for the UK will be released, as well as the April inflation data for Japan, and the weekly jobless claims for the US. On Friday, the focus will be on the flash estimates of Markit manufacturing PMI data for May for major economies like Japan, the United States, Germany, and the Euro Area. UK April retail sales and consumer confidence index for the Euro Area will also be released on Friday.
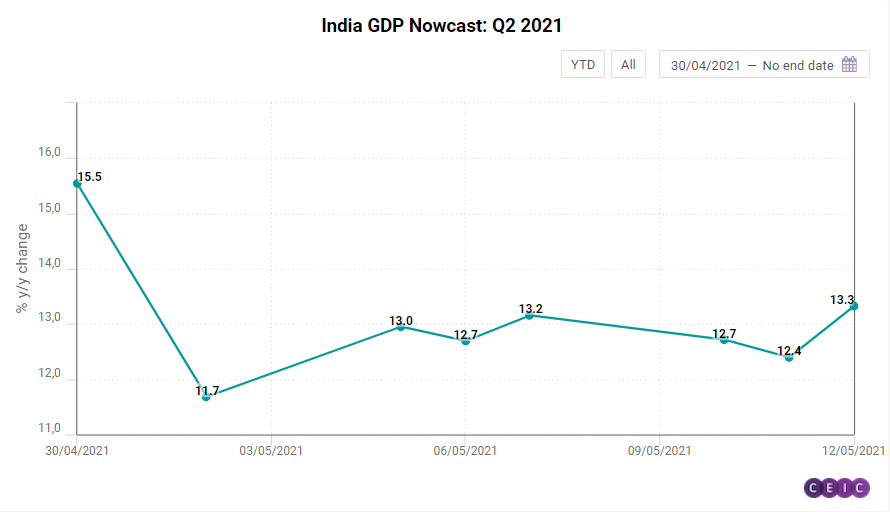
GDP Nowcast: India GDP to Increase by 3% in Q1 2021, and 12.4% in Q2 2021
Growth in electricity consumption accelerated even further in April 2021, by 39.2% y/y, but the impact on Q2 2021 GDP nowcast has been a negative 0.32%, owing to the sporadic lockdowns across India to control the second wave of infections.
Railway freight traffic increased 70.7% y/y in April 2021, contributing a positive 0.72% to the GDP nowcast for Q2 2021. In March 2021, air cargo traffic increased by 34.2% y/y while air passenger traffic declined by 3.37%, adjusting for low base. Foreign trade surged in April 2021 on account of the low base from 2020.
Exports and non-oil imports surged by 197.05% y/y and 178.5% y/y, respectively. However, the contribution of exports to Q2 2021 GDP nowcast is a 3.95%, far greater than the 0.34% contribution by non-oil imports. Foreign exchange rate contributed negatively to the GDP nowcast, by 0.47%, declining 1.5% y/y in actual numbers.
Scheduled commercial bank credit had a negative impact on the Q2 2021 nowcast as well, by 0.68%, despite a marginal rise in April 2021, by 5.7% y/y, as compared to the March growth of 5.6% y/y.
What is GDP Nowcast?
GDP Nowcast shows the current state of the economy in real time without having to wait for the official quarterly GDP data. We nowcast economic growth by using a set of selected high-frequency indicators that reflect all aspects of the economy, including manufacturing, consumption, services, financial sector, prices, external trade, and others.
Why are we “nowcasting”?
GDP data is released with significant lags and is not representative of the current state of the economy, while individual high-frequency indicators provide only fragmentary signals for the economic status quo. In contrast, our GDP Nowcast methodology is a combination of both – a comprehensive picture of the whole economy that is updated in real-time, which makes it a preferred tool for decision making and timely analysis.
Sign in to access the India GDP Nowcast Dashboard here.
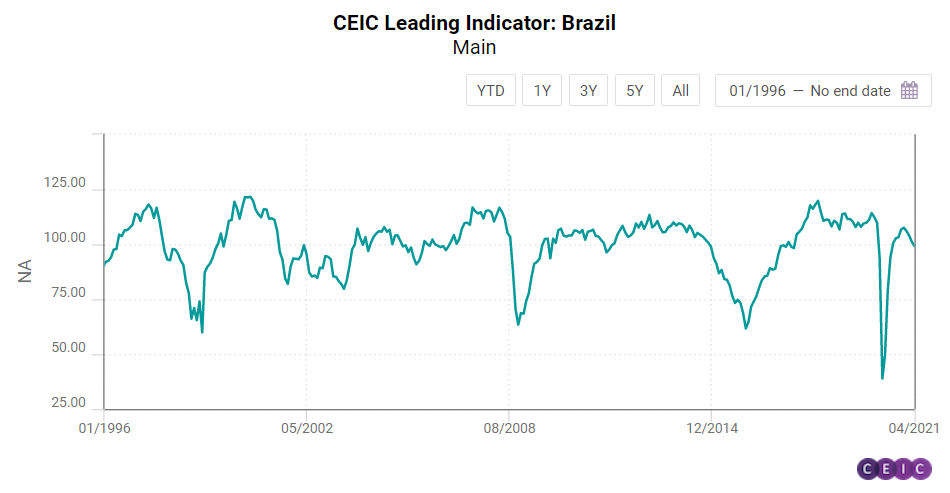
CEIC Leading Indicator: Brazil’s Recovery Slows Down amid Worsening Pandemic
The CEIC Leading Indicator for Brazil fell to 99.2 in April 2021 from 101.2 in March, as many regions implemented lockdowns to rein in the spread of COVID-19 and avoid a collapse of the healthcare system. The indicator stood below the benchmark value of 100 for the first time in nine months, which means that the recovery of economic activity in the next months may slow.
Some key variables supported the performance of the CEIC Leading Indicator in the fourth month of 2021. The manufacturing confidence indicator recorded its fourth fall in a row to 3.5% in April, seasonally adjusted, as many factories halted operations because of regional lockdowns and shortage of inputs. Consequently, the sales of new vehicles declined to 191,853 units from 208,801 in March.
Discover the CEIC Global Database and learn how you can gain access to over 6.6 million time-series data, covering over 200 economies, across 18 macroeconomic sectors.