
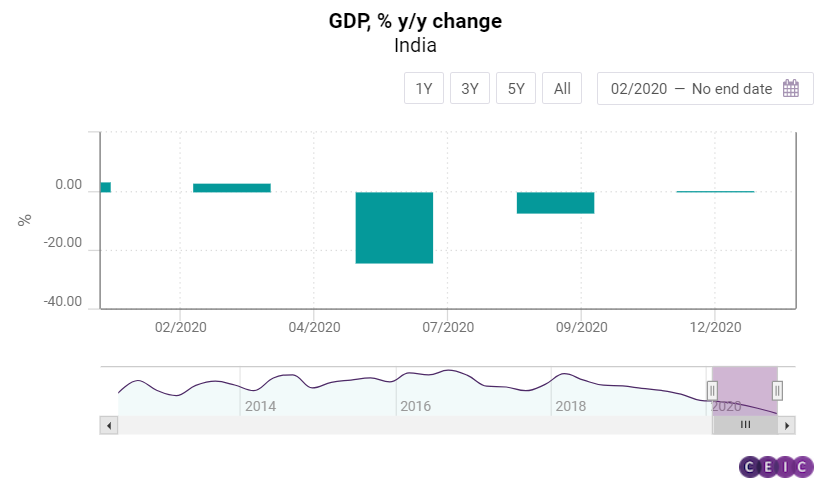
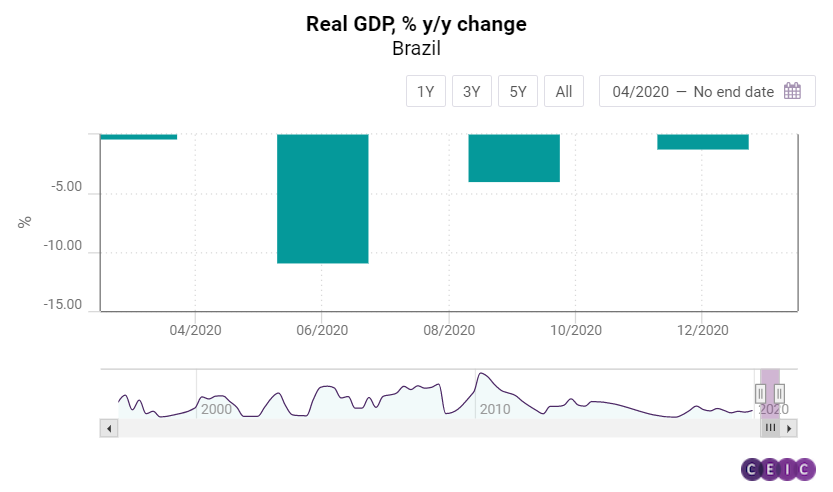
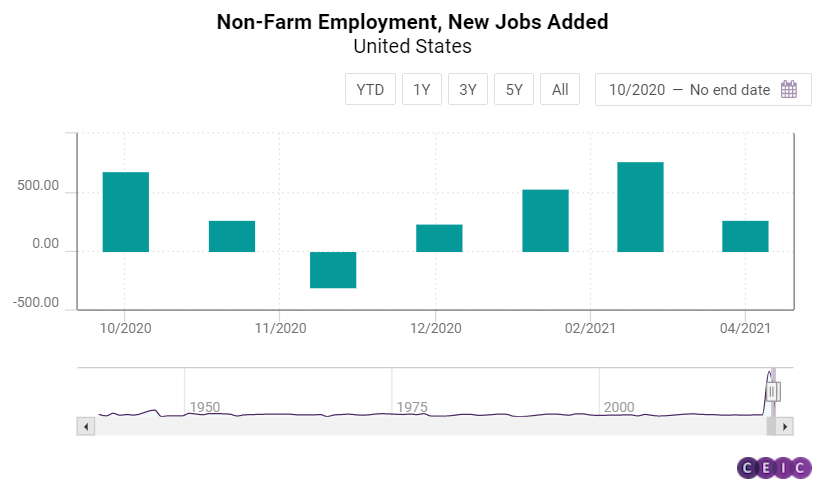
We are headed for a busy data week with Markit PMI data for May, Q1 GDP figures for India, Brazil, and Australia, and the US employment report.
On Monday, key economic activity data for Korea and Japan are expected to be released, including industrial production and retail sales, followed by China PMI data published by the National Bureau of Statistics. Japan's Cabinet Office will also publish its May consumer confidence survey results. In India, the April infrastructure output data will be released, followed by the Q1 GDP data.
On Tuesday, Markit manufacturing PMI for May will be released for some of the major economies including Japan, China, India, Euro Area, the United States, and Brazil. The Euro Area inflation is also expected to be published on that day with the headline inflation remaining below the ECB target despite the double-digit growth in energy prices. Retail sales for Germany, India's foreign trade data, and the Q1 GDP for Brazil will be also released on Tuesday.
On Wednesday, the Markit manufacturing PMI data will be published for another major emerging economy, Indonesia, followed by the Q1 GDP release for Australia. The April tourist arrival data and the May CPI data for Indonesia will also be published on that day, with inflation remaining at historic low levels. Producer price index for the Euro Area and industrial production for Brazil are also scheduled for Wednesday.
On Thursday, more Markit PMI data for India and China are expected - the composite and the services PMIs. Inflation on Turkey is also expected to be released on Thursday, followed by the weekly US jobless claims report.
On Friday, the Reserve Bank of India (RBI) will announce its interest rate decision with the repo rate, the RBI's benchmark rate, stuck at an all-time low of 4%. Retail sales for the Euro Area and Markit construction PMI will also be published on Friday. The week ends with the US employment report after the new jobs added slowed down to 266,000 in April, following a strong recovery of the labour market since the beginning of the year. Besides the net increase of non-farm payrolls, another indicator from the survey will be in focus - the average weekly and monthly earning. The development of wages in the US is a key indicator of whether the inflation rise is temporary or driven by more sustainable forces backed by the labour market.
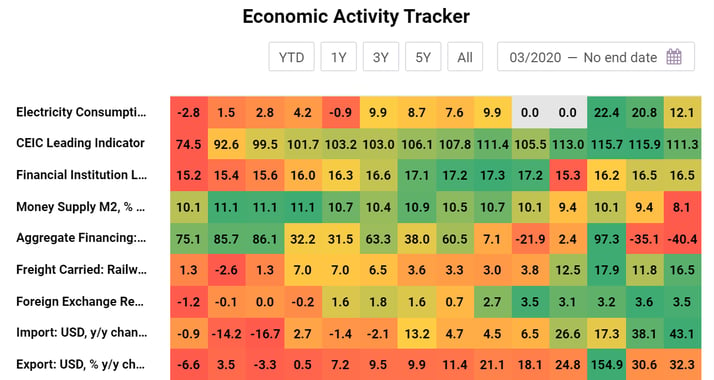
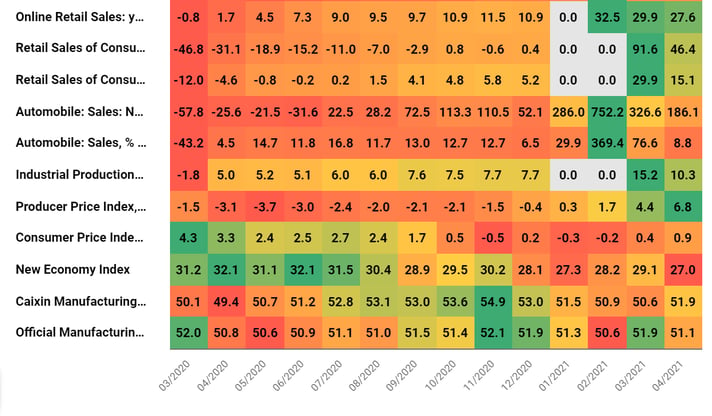
New Monthly Insight: China Economic Activity Tracker
The Economic Activity Tracker is a monthly publication that aims to provide a quick overview of the key high-frequency indicators of the economy. The publication is produced using data from CEIC's China Premium Database.
China: Uneven Economic Recovery Reflected by Key Indicators
- China’s industrial production, supported by strong external demand, remained robust in April, growing by 9.8% y/y. On a two-year average basis, which corrects for the low base in 2020, industrial production grew by 6.8%.
- In April, the electricity consumption of the industrial sectors grew by 12.1% y/y, another sign of the strong recovery on the production side.
- After four months of decline, the rebound in Caixin manufacturing purchasing managers’ index (PMI) bodes well for the performance of the small, private and export-oriented manufacturers in Q2.
- From January to April, the secondary industry attracted only RMB 4.2tn in fixed-asset investment, RMB 0.9tn lower than the amount in the first four months of 2019.
India GDP Nowcast | Weekly Update | Real-time GDP Nowcast projects 3% y/y increase for Q1 2021, 12.8% y/y for Q2 2021 as of May 21, 2021
Our estimate of India's GDP growth for Q2 2021 has declined compared to the previous week. As of May 21, the GDP Nowcast projects an increase of 12.8% y/y in Q2 2021, which represents an downward revision of 0.2 pp compared to our estimates a week earlier. Crude petroleum production, passenger car sales, and wholesale prices of fuel and power had a positive impact on the Q2 2021 GDP Nowcast, while electricity generation, two-wheeler sales, exports, non-oil imports, farm tractor sales, and petroleum consumption, caused the nowcast to decline.
The GDP Nowcast estimates an increase of 3% y/y for Q1 2021, which remains unchanged from the previous week.
- The decline in crude petroleum production moderated to 2.1% in April 2021 from 3.1% in March 2021, adding positively to the Q2 2021 nowcast, by 0.08%.
- Electricity generation April 2021 accelerated even further, by 42.5% y/y. However, it impacted the GDP nowcast for Q2 2021 negatively, by 0.2%.
- Petroleum consumption registered a significant increase by 81.6% y/y in April 2021, but removed 0.32% from the GDP Nowcast for Q2 2021.
- A surge in the wholesale price index for fuel and power by 20.9% y/y for the same period impacted the Nowcast positively by 0.19%
Sign in to access the full India GDP Nowcast insight.
Discover the CEIC Global Database and learn how you can gain access to over 6.6 million time-series data, covering over 200 economies, across 18 macroeconomic sectors.