-png.png)
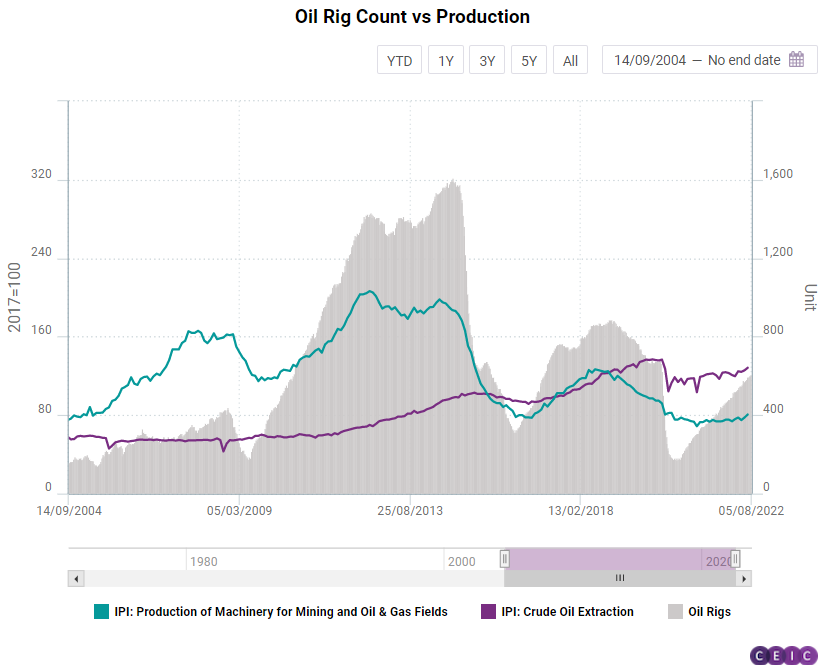
The oil rig count data provided by energy technology firm Baker Hughes has long been a closely monitored dataset for the oil sector and commodity investors. Unsurprisingly, the oil rigs dynamic precedes the oil production dynamic. In 2020, the oil rig count started declining in mid-March and the figures bottomed out in mid-August at 172 units, the lowest level since 2005. By contrast, the industrial production index (IPI) for crude oil extraction increased slightly in March before posting a more pronounced monthly decline in April and dropping significantly in May. Further, the IPI data is published roughly two weeks after the reference month has ended, meaning that by mid-May the IPI was confirming a trend was already established and visible in the oil rig count data at the beginning of April.
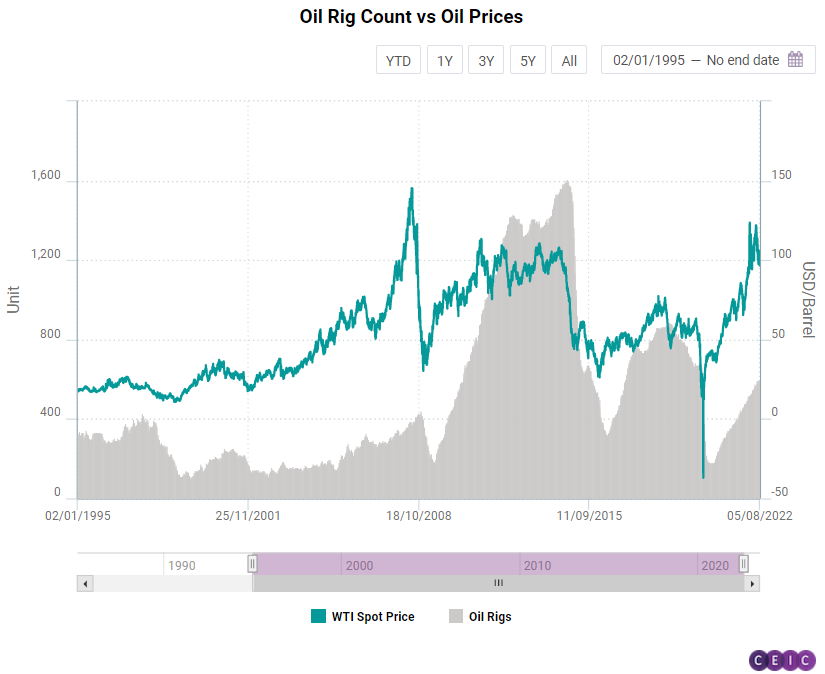
On the other hand, global oil prices, as volatile as they might be, correlate with the rig count data and even tend to precede it on most occasions. On the eve of the Great Recession in 2008, the US benchmark West Texas Intermediate (WTI) began its plunge in July, while the oil rig count followed suit as late as December the same year.
Further, if we dive deeper into the IPI breakdown, another sub-index stands out. The IPI for manufacturing of machinery for mining and oil & gas fields started decreasing in 2014, the year which marks the beginning of the global oil glut to which the US shale boom contributed. After such machineries, classified as the durable goods, have been manufactured, it takes a substantial amount of time to purchase them and make them operational.
Observing the most recent data, both alternative and traditional, we would argue that US oil production will keep increasing, providing a cushion to recessionary pressures stemming from monetary policy tightening. The rationale behind this conclusion rests on three factors:
- The oil rig count has been following a steep upward path for almost two years. During the week ending July 29, the count stood at 605 units, the highest level since March 2020 and approaching pre-pandemic figures.
- The WTI price is hovering around USD 100 per barrel. This is a price not seen since before 2014 and, despite the recent war related volatility, the trend since 2020 is an upward one.
- The seasonally adjusted IPI for production of mining and oil & gas fields machinery increased for two consecutive months in May and June and is at its highest level since April 2020. Further, the non-adjusted indicator grew on an annual basis by 9.3% y/y.