CEICData.com © 2018 Copyright All Rights Reserved
The Federal Reserve Bank of San Francisco has a keen eye on the news: using technology, it measures the tone of financial and economic headlines via the Daily News Sentiment Index (DNSI).
Effectively, this has resulted in a leading indicator: i.e., reading the news can get you ahead of the news, or at least ahead of data points with a lag and surveys that are released only monthly.
-png.png?width=1444&height=494&name=Daily%20News%20Sentiment%20Index%20a%20Visualization%20Using%20Computational%20Text%20Analysis%20(2)-png.png)
The DNSI has been in negative territory for much of the past three years, reflecting real-time worries about Covid-19 and the implications of the Fed's 2022 rate hikes. It ticked lower during the recent debt-ceiling standoff and rebounded when a Congressional act relieved that crisis. Most recently, it has reflected optimism that the Fed will finally start cutting rates, though the July-August market selloff resulted in a downward spike.
The index uses lexical analysis to scan articles about economics, business and finance in 24 US newspapers, detecting positive or negative sentiment based on news-related keywords. To generate a daily value, the DNSI methodology assigns geometrically declining weights to various articles based on the length of time since publication.


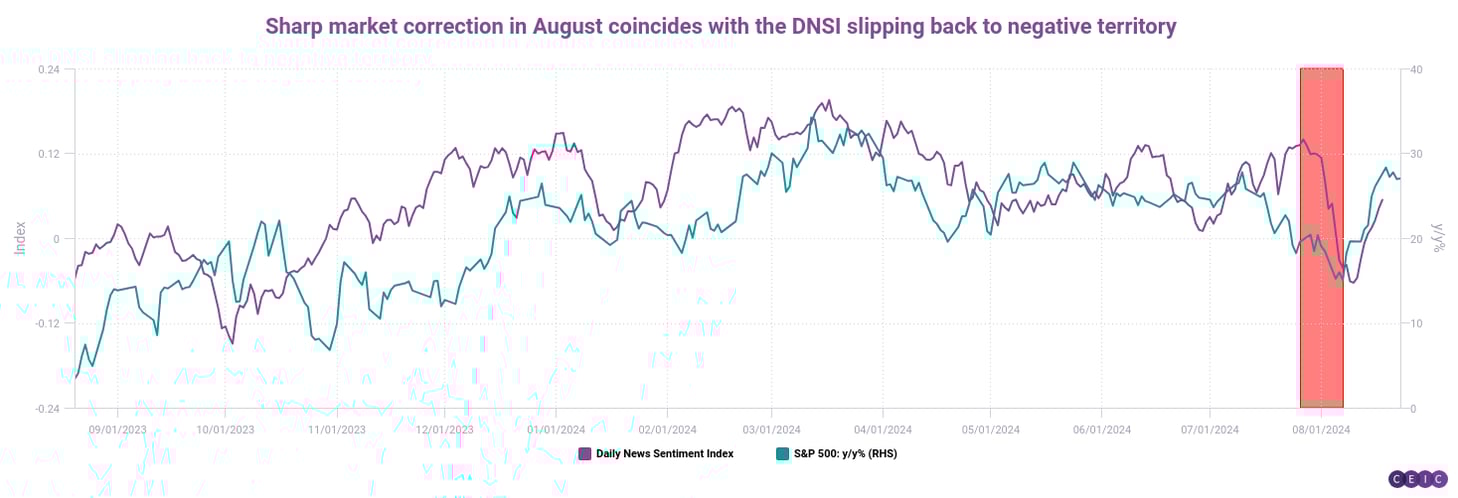
As our subsequent charts show, DNSI has been broadly predictive of its monthly, survey-based counterparts, e.g.: the University of Michigan's Consumer Confidence Index (CCI) and the Conference Board's Consumer Sentiment Index (CSI). The DNSI is also broadly reflective of official high-frequency indicators of financial and economic conditions, and even correlates with the S&P 500.
If you are a CEIC user, access the story here.
If you are not a CEIC client, explore how we can assist you in generating alpha by registering for a trial of our product: https://hubs.la/Q02f5lQh0