- In Q2 2020, China’s real growth beat consensus estimates by 60 bp. Its GDP deflator helped by declining by169 bp in headline terms.
- In Q1 2019, Chinese real growth exceeded expectations by 10 bp, while the GDP deflator dropped by 151 bp.
- In fact, if it were not for the plunge of GDP inflation, China’s boring, steady-as-she-goes real growth performance of the past four years would have disappeared.
- In 2017, nominal growth began to slow markedly but real growth continued to chug along with the disappearance of GDP inflation.
In Q2 2020, according to the official Chinese narrative about post COVID-19 recovery, China’s GDP managed to grow by 3.2% y/y, handily beating the 2.6% consensus expectation by 60 bp.To add to the woes, India has seen a sustained increase in y/y headline inflation since January 2019.
What was much less, if at all, reported was that this GDP increase was mightily helped by a plunge in China’s annual GDP deflator inflation by 169 bp. Up until that quarter, it seemed that GDP inflation had been percolating along at an annual pace of about at least 1.25%, but in Q2 2020, GDP inflation in China disappeared altogether so that what was 3.1% nominal growth became 3.2% real growth.
This was not the first time in recent history that such a phenomenon occurred. In Q1 2019, China’s GDP again beat consensus by a tick and was higher than expectations by 10 bp. At the same time, China’s GDP deflator inflation dropped by 151 bp. It is, of course, much easier to beat consensus by 10 bp if the GDP deflator falls by 151 bp.
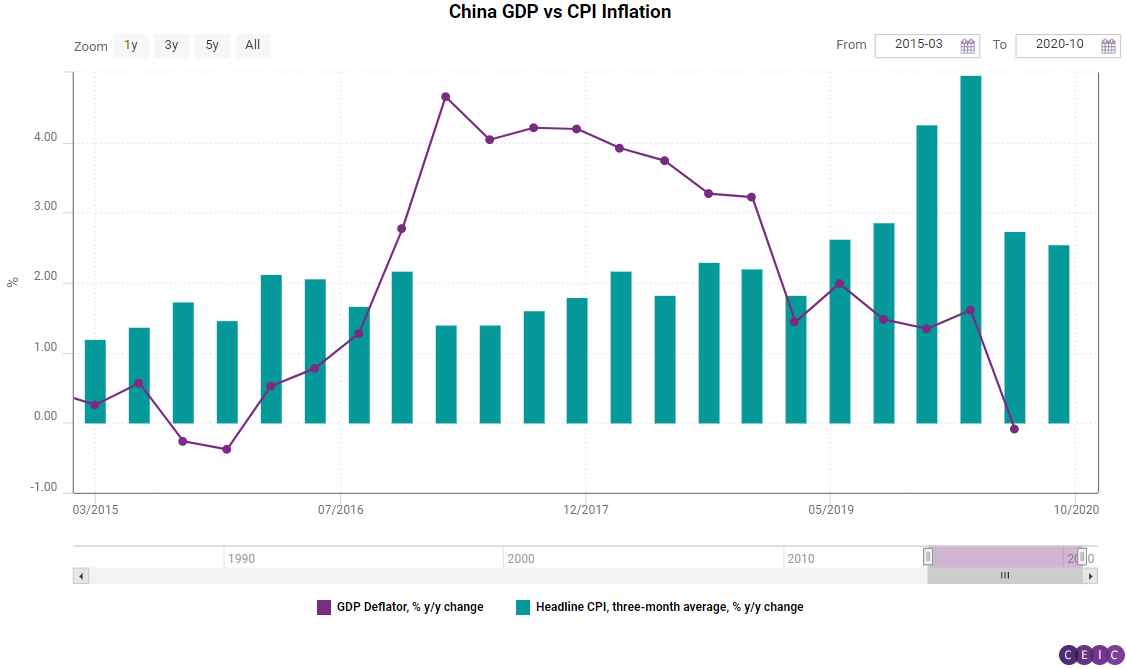
In the chart above, the solid line shows implied GDP inflation since it has been revealed in 2017. The bars are approximations of quarterly CPI inflation, using simple three-month moving averages of the annual inflation rates reported monthly by China’s National Bureau of Statistics (NBS). It has been a bit of a cottage industry in recent years to estimate China’s CPI in levels, since China, unlike all other G20 countries, still does not report CPI in levels. Anyway, to use solely official data, we simply go with the NBS’s reported annual CPI.
The two price indices show an apparent divergence.
In fact, we can say that if it had not been for China’s recent GDP inflation collapse, all of the country’s steady growth performance of the past four years, of which this pandemic year is the fourth in a row, would have disappeared. The chart below makes the same point as the one above in a slightly different way.
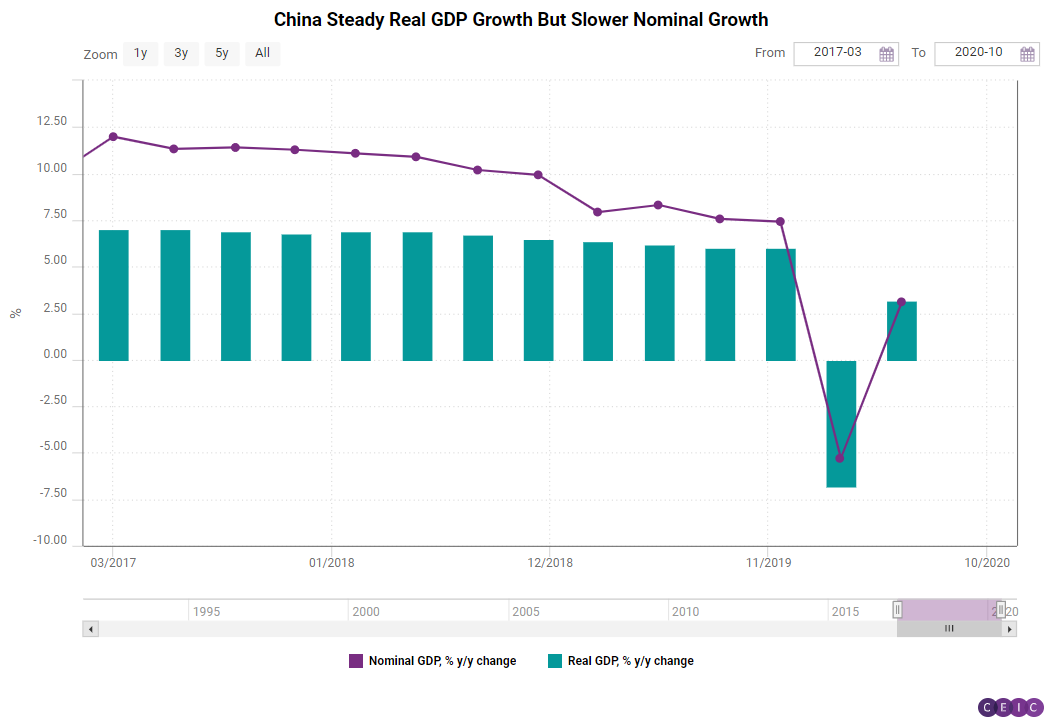
Those bars are the quarterly real growth rates that markets fixate over every three months, but the solid black line shows China’s continuously declining nominal growth rates. Nominal growth is what national income statisticians in China actually measure. Actually, that is a misstatement, since roughly half of the components that would normally go into any system of national accounts for China are not directly measured, but proxy-measured by various indices of activities that have been developed by the NBS.
So the NBS has been making efforts to adjust for the оver reporting. In a provocative paper published in the Brookings Paper on Economic Activity journal in 2019, Chen Wei of Hong Kong SAR's Chinese University and her collaborators argued that despite NBS’s efforts, the statistics office is still overestimating growth at the national level by 1.8 pp a year between 2008 and 2016. The South China Morning Post took their work and extrapolated that China’s true GDP in 2018 was 18 pp smaller than what was reported.
Now the interesting angle is that Chen et al. did their work on nominal growth, the purple line in the second chart above, and we see nominal growth slowing as if responding to the Chen et al. critique of overestimation from 2017 onwards (i.e., directly following the end of Chen et al.’s sample period). But real growth in China continued to chug along in a very steady fashion, and the question is what is the true role that GDP inflation (or its absence) plays in buttressing China’s growth record in the second half of this decade?
More recently, popular inflation in China, which soared in H2 2019 and Q1 2020 because of the African swine flu, has resumed picking up again, not because of pork as herd size recoveries have been more rapid than expected, but because of other meat bottlenecks. In the first chart we made the assumption that September CPI headline inflation will be just the July-August average, but it well may be higher. Against such a background, it would be difficult to understand a GDP deflator that either fails to ignite or possibly becomes even more negative. The implication is that service sector prices around China are plunging, but it is difficult to explain why that should be.
Sign in to read the full data analysis here. Alternatively, download the latest, comprehensive analysis of China's economy with the CEIC China Economy in a Snapshot Q3 2020 Report.