Analyzing the US and Japanese government bond yield curves over the years shows that when it comes to steepness, the two nations have "swapped places" several times over the past decade. We show this by charting the spread between 5- and 30-year bond yields for both nations.
-png.png?width=1464&height=501&name=Comparing%20the%20steepness%20of%20the%20US%20and%20Japanese%20yield%20curves%20(3)-png.png)
The Bank of Japan spent decades running unconventional monetary policy; from 2016, its yield curve control (YCC) program saw the central bank intervene in the short and long ends of the market to control interest rates. That resulted in a very stable and somewhat flat curve -- i.e., long term yields, and by extension inflation expectations, were not that much higher than their short-term equivalents.
The curve has steepened in recent years, especially since YCC was abandoned a bit more than a year ago and the BoJ got its long-sought sticky inflation.
Meanwhile, the US saw its yield curve (which was often steeper than that of Japan) invert during the historic post-pandemic tightening cycle; short-term rates are higher than their long-term equivalent. An inverted yield curve -- which effectively predicts rate cuts are coming soon -- was viewed as foreshadowing a recession that ultimately never arrived.
Even after the inversion ended and the US yield curve grew steeper, it has stayed flatter than its Japanese equivalent for more than three years now -- a phenomenon unseen since the mid-2000s.
Our subsequent charts explore different facets of the two nations' massive and globally consequential bond markets.
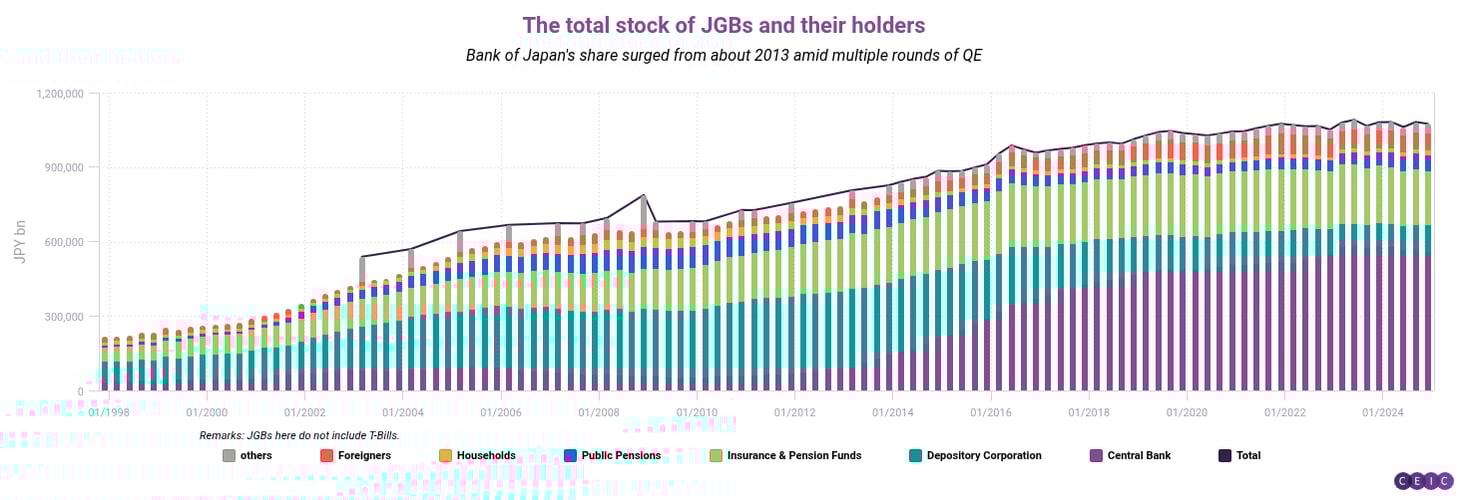
The BOJ is the largest holder of Japanese government bonds (JGBs); its share surged starting in the early 2010s amid multiple rounds of quantitative easing to stimulate the economy and end deflation. Insurers and pension funds hold the second-largest share. Recently, the share of JGBs held by foreign investors has been steadily increasing and the BOJ turned to quantitative tightening, i.e. selling off JGBs, as it normalized policy.
While 10-year JGBs remain the largest portion of the BOJ's holdings, the share of super-long-term bonds (such as 20-, 30- and even 40-year JGBs) increased in the 2010s; this was also a consequence of the YCC policy.
A steeper yield curve in Japan might attract more investors to engage in "flattener" strategies—selling short-term bonds and buying super-long-term bonds.
Turning to the US, concerns about the sustainability of budget deficits and persistent inflation have been reflected in relatively subdued bond auctions.
On May 21, an auction for USD 16 billion of 20-year Treasuries showed significantly weaker demand compared to the previous month, as measured by the bid-to-cover ratio. The highest yield in the auction rose to nearly 5.05% from 4.81% in the previous auction.
In terms of market structure, primary dealers (representing domestic US demand) were allocated 16.9% of the bonds, direct bidders received 14.1%, and indirect bidders (a measure of international investor demand and confidence in US Treasuries) were allocated 69%.


