
The CEIC Leading Indicator is a proprietary dataset designed by CEIC Insights to precede the development of major macroeconomic indicators and predict the turning points of the economic cycle for key markets. It is a composite indicator which is calculated by aggregating and weighting selected leading indicators covering various important sectors of the economy, such as financial markets, the monetary sector, labor market, trade and industry. It is developed through a proprietary CEIC methodology and employs data from the CEIC database. The CEIC Leading Indicator currently covers eight regions - Brazil, China, India, Indonesia, Russia, the Euro Area, Japan and the United States.
The August values of the CEIC Leading Indicator reveal that all of the surveyed regions are operating above their long-term trend or are getting close to it.
However, the low-base effects from the hardest months of the COVID-19 lockdown in spring are starting to fade away and the increase in the figures is not as strong as it used to be. Moreover, monthly declines have been observed in China and Russia, albeit on a very minor scale. In total, four countries are currently operating above the long-term trend of 100 - Brazil, Russia, India and China - while the US, the Euro Area, Indonesia and Japan scored values over 90. In addition to this, the smoothed CEIC Leading Indicator for all eight regions is expanding, suggesting that the trough in the business cycle is behind them.
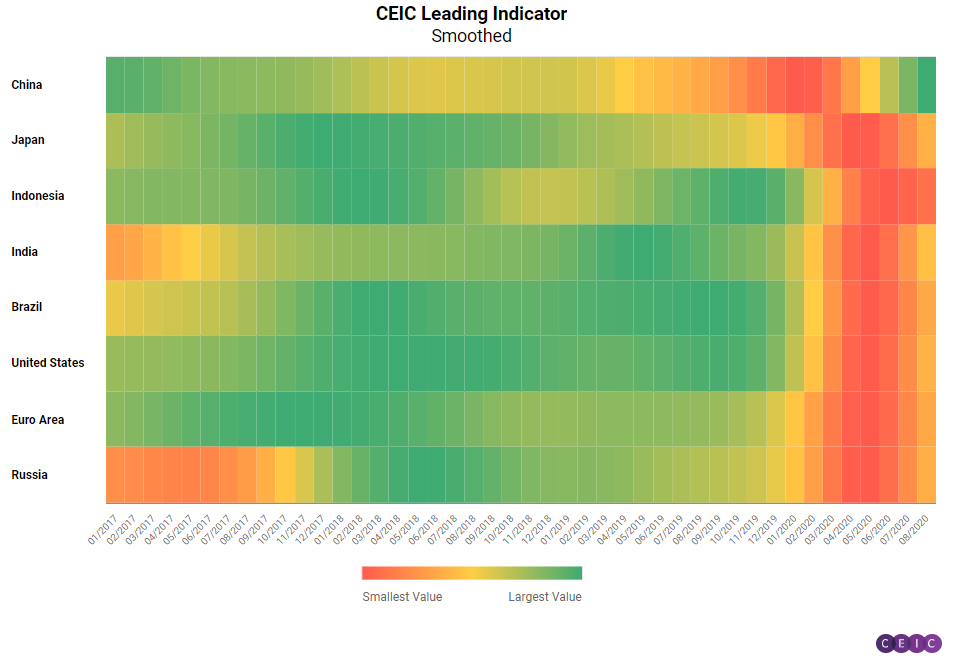
China: Economic Recovery Flattens Out
The development of China's CEIC Leading Indicator has remained relatively steady since June, ranging between 109 and 110. In August it declined marginally by 0.6 points m/m, but overall, the 109.2 result suggests that the economy is still in an expansion phase, above the long term trend of 100. The smoothed CEIC Leading Indicator for China continued to increase, reaching 113.3, its highest level since Jan 2017. This performance suggests that China is still on the path to continued recovery after the hit of the pandemic and economic acceleration can be expected in the fourth quarter of the year.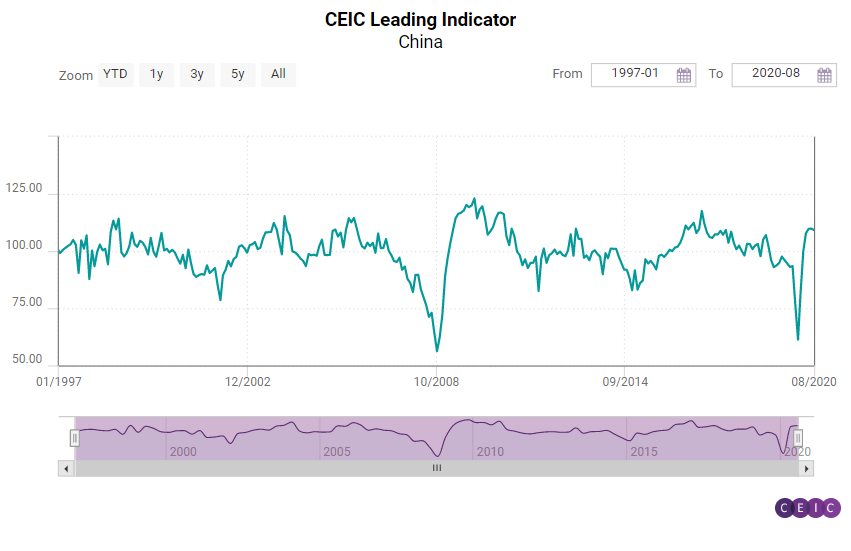
Automobile production saw a decrease compared to July but grew by 4.4% y/y, signalling the continued recovery of the automotive industry. Money supply increased to RMB 213.7tn, a record high number in the past five years, growing at a 10.4% annual rate. After reaching a plateau in July, the growth of financial institution deposits has picked up again to reach 10.25% y/y in August. Manufacturing confidence continues to be solid according to the National Bureau of Statics’ manufacturing PMI, which remains stable above the neutral point of 50%, at 51% in August. The real estate sector is recovering with the floor space sold of commodity buildings increasing for the eighth consecutive month. Compared with the same period last year, however, it still decreased by 3.3%The development of China's CEIC Leading Indicator has remained relatively steady since June, ranging between 109 and 110. In August it declined marginally by 0.6 points m/m, but overall, the 109.2 result suggests that the economy is still in an expansion phase, above the long term trend of 100. The smoothed CEIC Leading Indicator for China continued to increase, reaching 113.3, its highest level since Jan 2017. This performance suggests that China is still on the path to continued recovery after the hit of the pandemic and economic acceleration can be expected in the fourth quarter of the year.
US, Euro Area and Brazil: Close to Normal Economic Activity
The three regions that were the most affected by the COVID-19 crisis – the US, the Euro Area and Brazil – continued to improve for a fourth month in a row.
The historically poor result in April seems like a distant memory now, as the US economy had another strong month in August and the CEIC Leading Indicator increased by 5.8 points m/m to 96.7, getting close to its long term trend of 100. The stock market index S&P 500 reached another historic high at the end of August, peaking at 3,500.3.
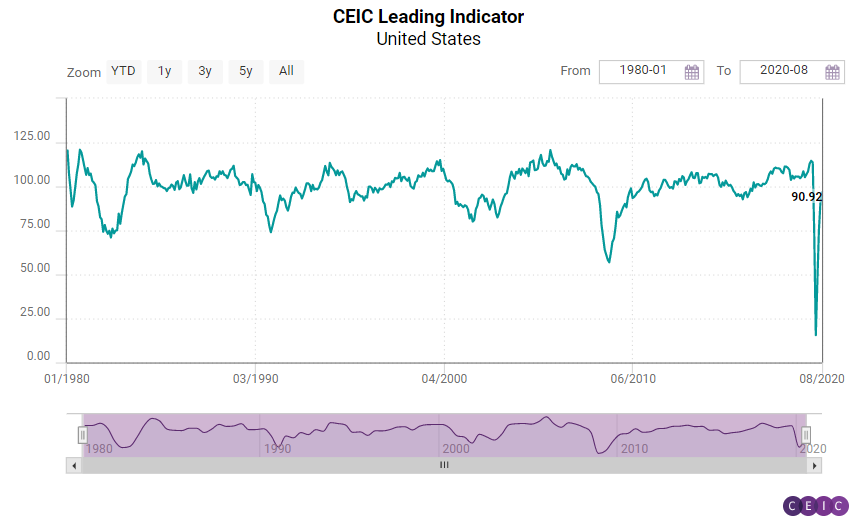
Further backing the indicator’s robust performance was an increase in the housing market index, which also reached its strongest figure on record at 83. The manufacturing PMI is at its highest level since the end of 2018, signifying a rebound in the sector. The labour market’s improvement is steadier but also consistent. On the other hand, motor vehicle sales continue to underperform, decelerating in August, and consumer confidence dropped for a second month in a row to levels close to those during the harshest phase of the lockdown.
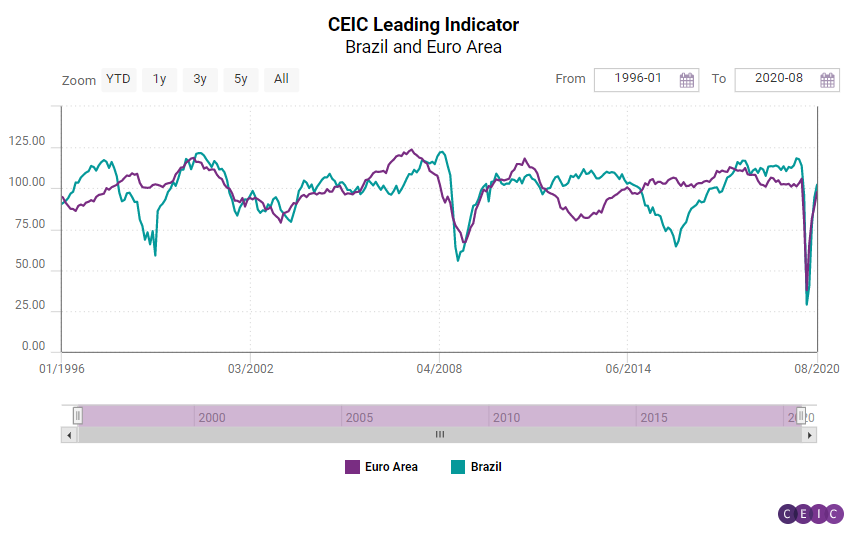
Signals from the Euro Area continue to be positive, after the dismal months of March and April, when large-scale lockdowns occurred among the leading economic powerhouses of the monetary union. The m/m increase in the Euro Area was even stronger than in the US, and the CEIC Leading Indicator jumped by 8.9 points to 97.7 in August. The Dow Jones Euro Stoxx index managed to erase some of the losses in July and reached a five-month peak in August, although it is still far from the pre-lockdown levels. Construction and industrial sector confidence continued to steadily improve but consumer prospects stagnated.
In August, for the first time in six months, the CEIC Leading Indicator for Brazil exceeded the base value of 100 to reach 102.1, the fourth increase in a row, meaning that the country may see an economic upturn in the first quarter of 2021. The positive performance in August was supported by some key variables. The manufacturing confidence indicator was -1.3, the highest level since February 2020, compared to -10.2 in July. Motor vehicle sales continued to accelerate in August, reaching 193,650 units in the month, compared to 184,818 in July.
The construction companies foresee a rebound of the sector’s activity, as the expectation to purchase inputs improved to 52.8 in August 2020, above the neutral value of 50, and is almost at the same level as in August 2019 (52.6). International crude oil prices continued to rebound, reaching USD 45.2 per barrel in August, compared to USD 43.4 per barrel in July. The equity market index, however, inched down to 99,369 in the end of August, from 102,912 in the end of July, amid uncertainties related to the surge in government expenditures and the sustainability of public debt.
Japan, India, Indonesia and Russia: Robust Perfromance but at a Slower Pace
The CEIC Leading Indicator for Russia, Japan, India and Indonesia is either at or is approaching the long term trend of 100, meaning that their economic performance is going back to normal.
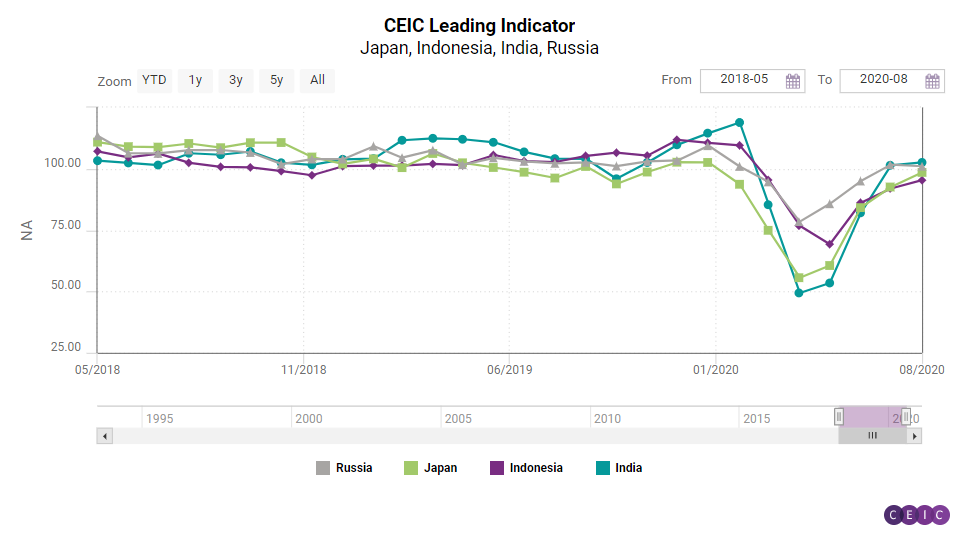
Similar to China, Japan endured the COVID-19 shock slightly earlier than most economies and by May the leading indicator started showing signs of a rebound. In August, the CEIC Leading Indicator recorded its fifth consecutive month of increase reaching 98.5 on the back of a recovery in the stock market and increasing manufacturing sentiment. More importantly, the smoothed CEIC Leading Indicator grew for a fourth month in a row, to 90.6, giving strong signals that Japan is currently at the expansion phase of the business cycle.
Keeping up the positive trend, the CEIC Leading Indicator for India rose to 102.6 in August 2020 from 101.4 in July. The key drivers of this increase are the narrowing declines in automobile sales and steel production. Passenger car sales have seen a V-shaped recovery, and are back to pre-COVID-19 levels, even though sales declined by 6% y/y in August. In terms of metal production, crude and finished steel declined by 4.2% y/y and 5.5% y/y respectively, but this has been a substantial improvement, bringing them closer to their 2019 levels. Electricity production declined by 2.6% y/y in August as compared to a 0.1% y/y decline in July. The growth of financial indicators such as 91-day treasury bills and money supply moderated. The growth of wholesale food price inflation also slowed down. The turnaround in the smoothed CEIC Leading Indicator also continued further – it increased to 92.9 in August 2020 from 87.33 in July. The increase in the smoothed indicator for two consecutive months sparks hope for sustained recovery of the economy, despite the daily number of COVID-19 cases in India becoming the highest in the world. India saw the sharpest historical contraction in GDP by 23.9% y/y in the second quarter of the year as a result of the lockdown.
Indonesia was among the economies where the COVID-19 pandemic had a slightly delayed effect – while most countries suffered the biggest dip in economic performance in April, Indonesian CEIC Leading Indicator data hit a trough in May, at 69.3. Afterwards, the country recorded three consecutive months of acceleration and in August the leading indicator value stood at 95.4, spurred by improving palm oil prices, appreciating rupiah and a gradual rebound of the stock market. In addition to this, the smoothed CEIC Leading Indicator for Indonesia has accelerated for a second month in a row, raising hope that the lowest point of the business cycle occurred in June and Indonesia is on the path to sustained expansion.
Russia remains the only surveyed country, apart from China, where the CEIC Leading Indicator experienced a slight decline on a monthly basis – by 0.7 points to 101 in August. Nevertheless, the score suggests that the economy is operating at a level above the long-term trend. Manufacturing production reached pre-crisis levels and crude oil prices continued to recuperate which had a positive effect on the Russian economy. On the other hand, automobile sales declined once more in August, after a brief return to growth in July, and the sluggish performance of the RTS stock exchange index suggests that the stock markets have a rather hard time returning to their pre-pandemic levels. Nevertheless, the smoothed CEIC Leading Indicator continued to accelerate, implying that Russia’s business cycle is likely in an expansion phase.
Keep informed each month on the predicted turning points of the economic cycle for key markets with our free, proprietary CEIC Leading Indicator. Learn more and register here
.png?width=160&name=ceic-logo-Vector%20logo%20no%20tagline%20(002).png)
