
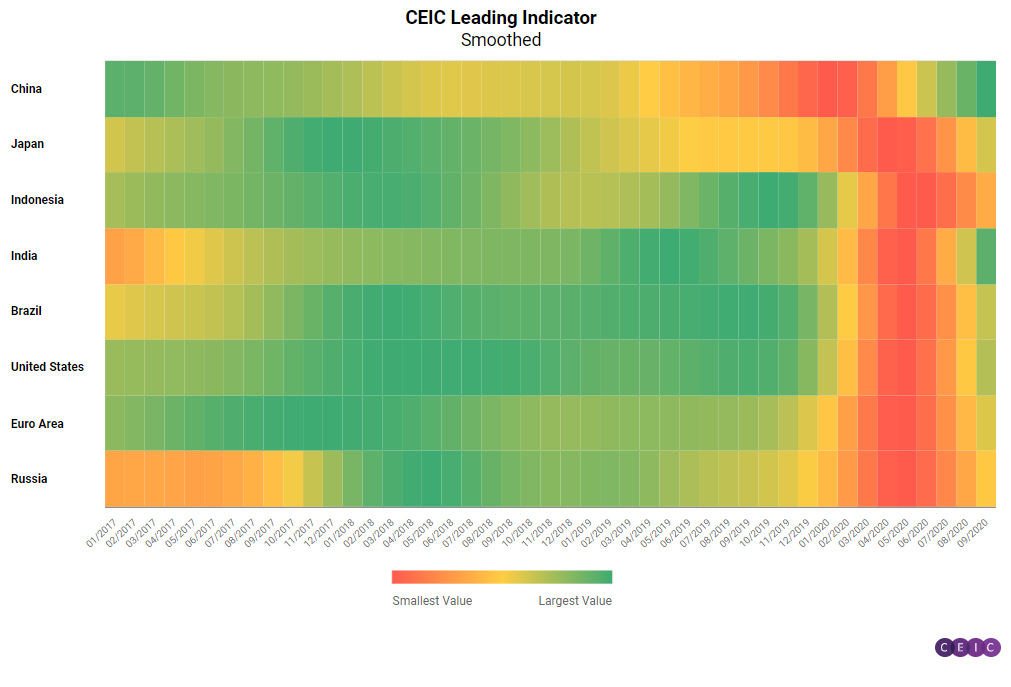
The CEIC Leading Indicator is a proprietary dataset designed by CEIC Insights to precede the development of major macroeconomic indicators and predict the turning points of the economic cycle for key markets. It is a composite indicator which is calculated by aggregating and weighting selected leading indicators covering various important sectors of the economy, such as financial markets, the monetary sector, labor market, trade and industry. It is developed through a proprietary CEIC methodology and employs data from the CEIC database. The CEIC Leading Indicator currently covers eight regions - Brazil, China, India, Indonesia, Russia, the Euro Area, Japan and the United States.
September 2020 saw an increase in values among all economies covered by the CEIC Leading Indicator, with only Indonesia still operating below the long term trend of 100.
China went back on the way of acceleration after a marginal monthly decline in August. Developments in India, Brazil, the US and Japan were very positive with large jumps compared to the previous month, while acceleration in the Euro Area and Russia was more subdued. Moreover, for all eight regions there is definite evidence that the trough in the business cycle is behind them, as the smoothed CEIC Leading Indicator increased for yet another month.
China: Strong Growth Momentum
Despite a decline of 1.2 points in August, the CEIC Leading Indicator for China reached 110.8 in September, a record high in nearly three and a half years. With the exception of the slight decline in August, the indicator has maintained an upward trajectory since May, exceeding the benchmark value of 100 and indicating strong GDP growth acceleration prospects.
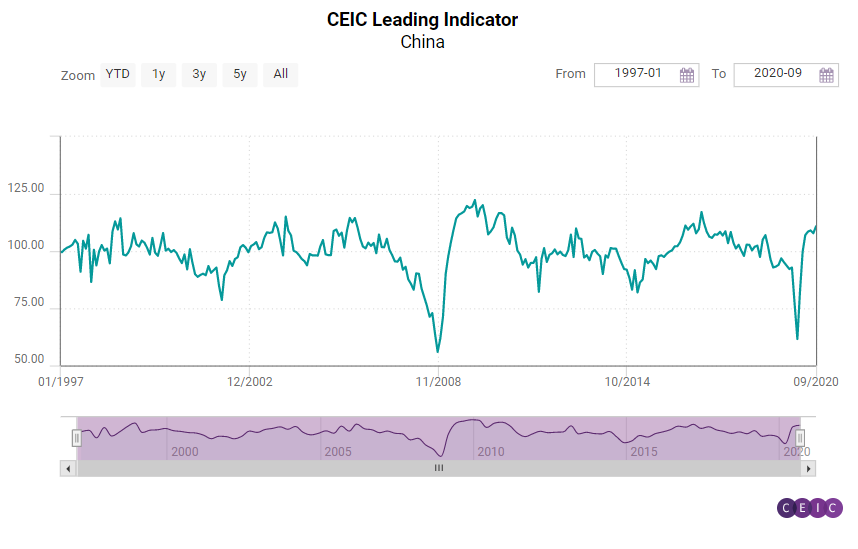
The continued recovery on the consumer side provided a boost to the automobile industry. In September automobile production surged again, after declining in July and August. In September, the output of motor vehicles was up by 373,000 units compared to the previous month and increased by nearly 11% y/y. Money supply was up 10.9% y/y, growing for the third month in a row and reaching RMB 216.4tn, the highest value in two decades. Financial institution deposits followed a similar trend, climbing all the way up to a record high in more than two decades, with a 10.7% increase y/y in September. Manufacturing confidence improved as China’s official PMI increased from 51 in August to 51.5 in September, the highest number since April this year. As of September, the floor space sold of commodity buildings, however, was still below the pre-pandemic levels. In the first nine months of 2020, it declined by 1.8% y/y.
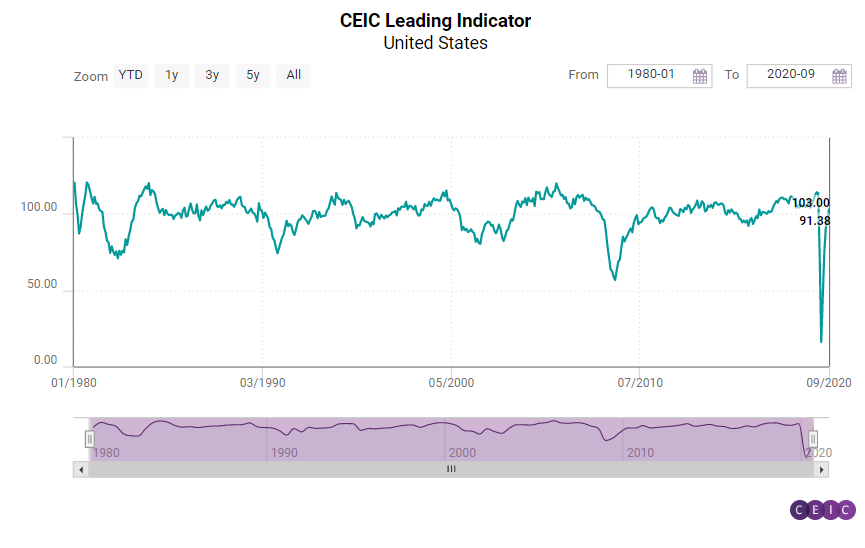
US, Euro Area and Brazil: All Above 100
The three regions affected the strongest by the COVID-19 crisis – the US, the Euro Area and Brazil – had another strong month of growth and September marks the first month since the start of the pandemic when all three rose above the threshold level of 100.
The CEIC Leading Indicator for the US rose to 103 in September, getting closer to its strong performance immediately before the pandemic began. Sales of motor vehicles had a much anticipated comeback and grew on annual basis for the first time since February – by 5% y/y to a total of 1.38mn vehicles. Consumer confidence also returned to form, increasing on a monthly basis for the first time in three months. The housing market index continued to over-perform and its September value was the strongest on record, at 83. On the other hand, manufacturing activity disappointed, with manufacturing PMI ceasing its continuous acceleration since May, while capacity utilisation dropped by 0.5 pp m/m.
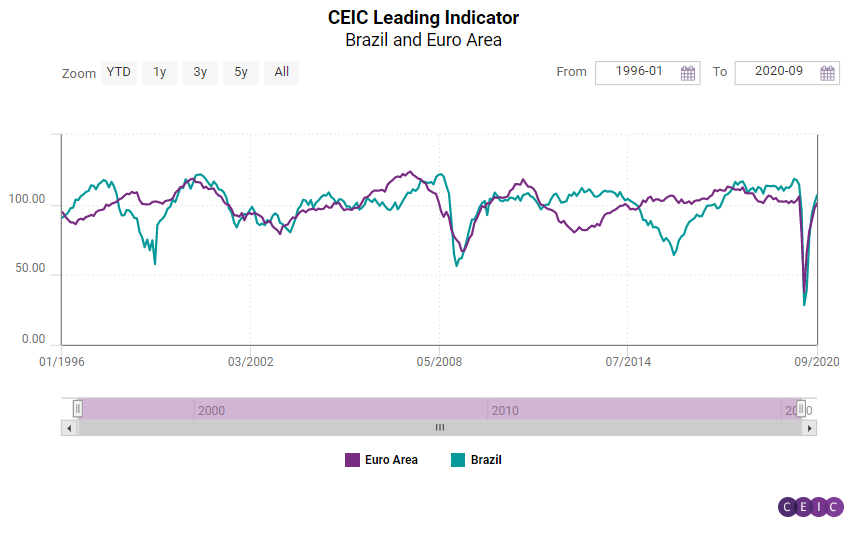
Economic activity in the Euro Area was steadier, but the union also managed to surpass the threshold level of 100, reaching 101 in September. Consumer, construction and industrial confidence improved for yet another month since the pandemic started, revealing better prospects both on the supply and demand side of the economy. Employment in manufacturing is also recovering, reaching pre-crisis levels. However, the stock market performance was less optimistic with the Dow Jones Euro Stoxx index dropping to 353.8 from 360.6 in August, still far below the figures at the beginning of the calendar year.
The CEIC Leading Indicator for Brazil recorded its fifth increase in a row in September, reaching 104.6 and inching closer to pre-COVID levels. In August, the indicator was 101.4 and exceeded the benchmark value of 100, which separates a GDP acceleration prospect from a deceleration one. Most of the sectors continued to rebound in September, indicating that the country’s economy is expected to return on a growth path in the first quarter of 2021. The government’s cash transfer programmes and lower interest rates supported the surge in domestic demand and the increasing economic activity, despite the slow reaction of the labour market. The manufacturing confidence returned to positive terrain in September, recording 6.7, after six months below the zero threshold. Construction companies foresee a rebound of the sector’s activity, as the expectation to purchase inputs improved to 55.6 in September 2020, above the neutral value of 50, and higher than in September 2019 (53.7). Crude oil prices, on the other hand, inched down to USD 41.5 per barrel in September, from USD 45.2 per barrel in August, amid uncertainties surrounding the economic recovery in the US and the EU. On the domestic side, the fiscal stimulus package had a strong impact on the country’s public finance, increasing fiscal risks. As a consequence, the equity market index dropped to 94,603 in the end of September from 99,369 in the end of August.
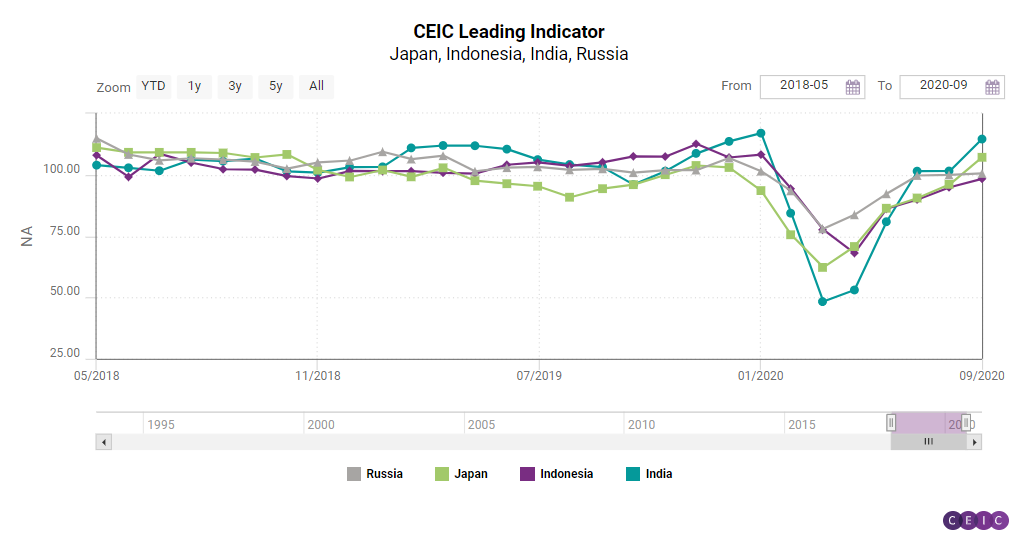
The CEIC Leading Indicator for Japan recorded its fifth consecutive month of acceleration in September but more importantly it grew by 11 pp m/m to reach a value of 107.1, the highest reading since November 2018. Both consumer and manufacturing confidence improved considerably and motor vehicle sales recorded a growth m/m although the automotive industry still performs under the pre-pandemic levels. The stock market index increased for the second month in a row on a monthly basis, coming closer to the pre-COVID activity levels.
India has had the most impressive comeback among all surveyed regions and the CEIC Leading Indicator jumped to 114.6 in September. This increase is primarily driven by improving industrial production and rising wholesale food prices. The declines in crude and finished steel moderated further from their August values of 4.4% y/y and 3.3% y/y to 1.7% y/y and 0.7% y/y in September, respectively. Gross generation of electricity registered its first increase in September, by 4.4% y/y, since March 2020 when the outbreak of COVID-19 started in India. On the other hand, the year-on-year growth of financial indicators such as treasury bills and money supply slowed down, even though they remained above their averages. Wholesale food prices rose by 6.9% y/y in September as compared to 4.1% y/y in August.
Indonesia is the only economy among the surveyed ones where the CEIC Leading Indicator has not yet risen above the long-term trend of 100. Nevertheless, the value of 98.4 suggests that the country is getting there, albeit at a slower pace. Growth of non-oil exports was positive again in September, after two consecutive months of y/y declines. Cement consumption is improving at a steady pace, but on an annual basis it is still considerably below the pre-pandemic levels. The same can also be said about the sales of motor vehicles. The price of crude palm oil is also contributing to a better economic performance.
Russia’s recovery has hit a plateau, as the CEIC Leading Indicator has hardly increased in value in the past three months. The annual growth in sales of new automobiles declined marginally for the second month in a row and a similar development could be observed with regard to the freight carried by railway. The stock market index managed to lose what it had gained between May and August, dropping to 1,178.5 from 1,258.6 in the previous month. Crude oil prices declined for the first time since April, which is a worrisome signal for the export-dependent Russian economy.
Keep informed each month on the predicted turning points of the economic cycle for key markets with our free, proprietary CEIC Leading Indicator. Learn more and register here