-png.png)
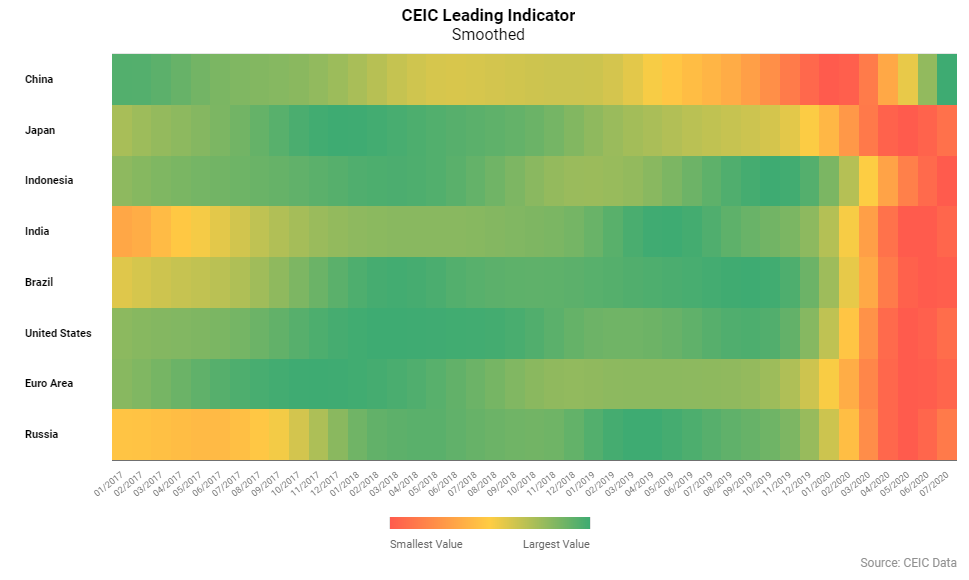
The CEIC Leading Indicator is a proprietary dataset designed by CEIC Insights to precede the development of major macroeconomic indicators and predict the turning points of the economic cycle for key markets. It is a composite indicator which is calculated by aggregating and weighting selected leading indicators covering various important sectors of the economy, such as financial markets, the monetary sector, labor market, trade and industry. It is developed through a proprietary CEIC methodology and employs data from the CEIC database. The CEIC Leading Indicator currently covers eight regions - Brazil, China, India, Indonesia, Russia, the Euro Area, Japan and the United States.
With GDP figures covering the April-June 2020 quarter in line with the CEIC Leading Indicator's signals during that period, July data reveals that the majority of the surveyed regions have likely passed a tough and are back to an expansion phase.
The smoothed CEIC Leading Indicator which is a useful gauge for the long term performance of the economy, revealed a return to acceleration for the US, the Euro Area, Brazil, Japan, India and Russia and confirmed that the strong performance in the months post April was not just a momentary uptick. On the other hand, the non-smoothed CEIC Leading Indicator passed the long-term trend of 100 for Russia, and rose significantly in almost all regions covered, with the exception of China, where the low-base effect from the beginning of the year is starting to fade away. Nevertheless, China continues to enjoy significantly stronger performance compared to the rest.
China: Low-Base Effects Might be Over
The rapid post-lockdown expansion of the CEIC Leading Indicator for China came to an end in July 2020, as it declined very marginally by 0.1 points m / m. Since its trough in February 2020 when the indicator fell to 61.7, the lowest value since the 2008-2009 Great Recession, it showed a remarkable comeback, reaching a three-year peak of 110.8 in June. However, the indicator's performance has been showing signs of moderation since May and it seems that as of July, the low base effects from the poor performance in January and February, when the COVID-19 outbreak hit China the hardest, have faded.
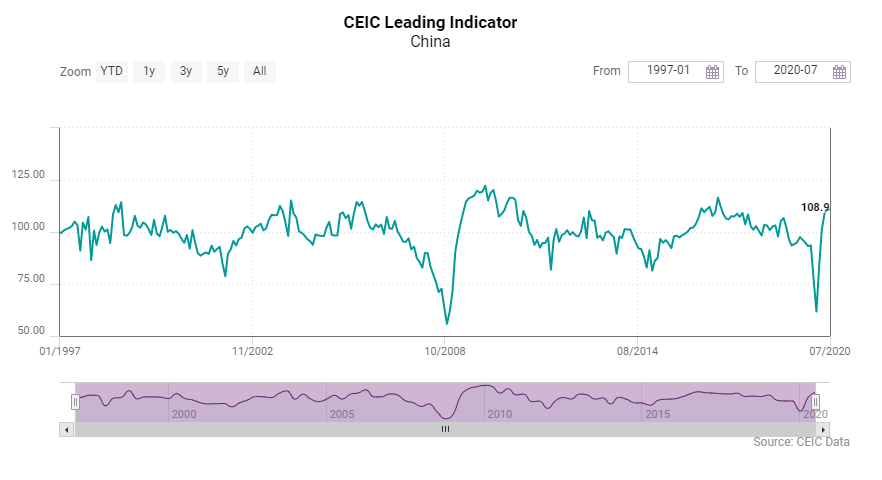
The automobile sector, which was severely hit by the pandemic not only in China but also globally, continues to recover, although July figures suggest a slight moderation in automobile production on a monthly basis, as output was down by 53,000 vehicles compared to June. Nevertheless, in y / y terms, the growth stood at 21.8%, the highest since September 2016. The increase in money supply M2 also decelerated in July, falling below 11% y / y for the first time since March. Growth of financial institution deposits also reached a plateau, ending its continuous acceleration since February, at 10.3% y / y compared to 10.6% in June. Manufacturing confidence continues to be solid according to the National Bureau of Statics' manufacturing PMI, which remains stable above the neutral point of 50%, at 51.1% in July.
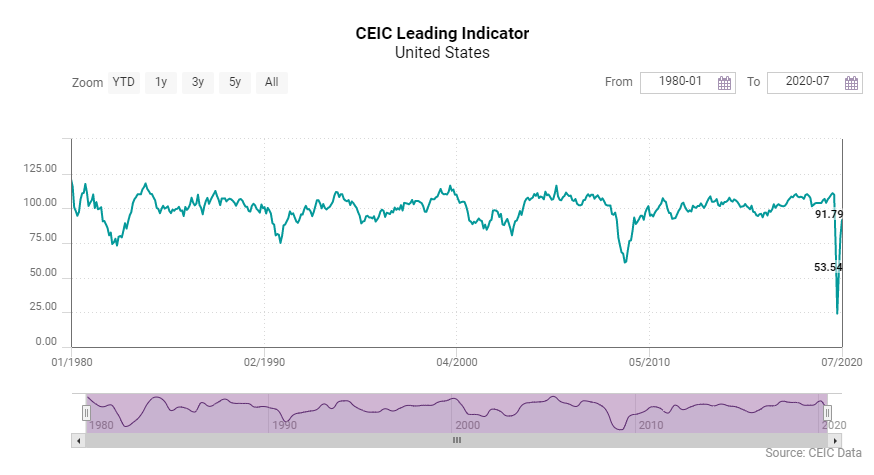
US, Euro Area and Brazil: The Trough is Behind
July data confirmed the solid increase in pace of the CEIC Leading Indicator for the US, the Euro Area and Brazil, which started in May but really picked up in June.
The solidly performing US CEIC Leading Indicator dropped significantly in the months of March and April 2020 when the COVID-19 pandemic started to take its toll. The April value of 24 remains the lowest on record. What followed in May was a recovery of the stock market, improving labor market indicators and a weak revival in the housing and automotive markets and in June the housing market approached its pre-crisis levels, consumer confidence improved and the purchasing managers' index had a notable return to form. The robust increase in July was backed by a further improvement in labor market conditions, record-high gains on the stock market and an increase in manufacturing capacity utilization. What is more, the US smoothed leading indicator increased for the first time since March 2018,
Signals from the Euro Area continue to be positive, after the dismal months of March and April, when large-scale lockdowns occurred among the leading economic powerhouses of the monetary union. The CEIC Leading Indicator of the Euro Area reached 88.5 in July, a more modest m / m growth compared to June, but still confidently on the road to recovery. The July performance was driven by steady m / m increases in most key variables such as consumer and industrial confidence, capacity utilization and manufacturing PMI while the stock market lost some ground compared to the previous month. An encouraging sign was the return to acceleration of the smoothed CEIC Leading Indicator, which rose for the second month in a row, to 75.3, after 30 months in a downturn phase.
The CEIC Leading Indicator for Brazil improved for the third month in a row in July, reaching 93.7, and gеtting closer to the levels observed before the COVID-19 crisis. Despite the improvement, the indicator continues to stay below 100, which means that the country's economy is expected to operate below the long-term trend in the coming six to nine months. The positive performance in July was supported by some key variables. Motor vehicle sales increased to 184,818 units in July, compared to 135,183 in June, as the vast majority of car stores in the country reopened. The manufacturing sector also performed better in July, as the industry's confidence indicators climbed to -10.2, from -22.4 in June. In the construction sector, the companies foresee some stability, as the expectation to purchase raw materials improved to 49.5 in July, very close to the neutral value of 50. International crude oil prices continued to rebound, reaching USD 43.4 per barrel in July, compared to USD 37 per barrel in June. Moreover, the Sao Paulo stock exchange index reached 102,912 at the end of July, compared to 95,056 points at the end of June, and exceeded the 101,812 registered in July 2019.
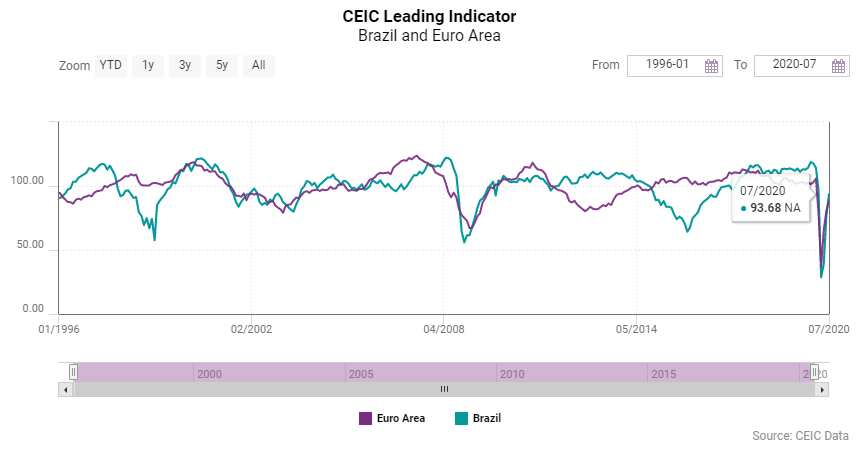
The prospect for a severe recession in 2020 remains, as the smoothed CEIC Leading Indicator remained below the neutral point of 100 for the fifth month in a row. However, the long-term negative trend was interrupted in July, as the smoothed indicator saw a slight uptick to 69.5, after falling to 68.9 in June, the lowest value in 11 years. These figures indicate that the economic activity in the first quarter of 2021 may approach stability on an annual basis, mirroring the performance of Q1 2020.
Japan, India, Indonesia and Russia: Keep on Pushing
Russia and the three Asian economies covered by the CEIC Leading Indicator responded more robustly to the COVID-19 crisis in the early months of the pandemic, and July data continues to suggest that this group is still on the right path to recovery. Along with China, Japan endured the COVID-19 shock at the earliest phase of the outbreak, and the CEIC Leading Indicator decreased from 102.6 in January to 55.5 in April, but at a relatively steady pace. Since then, the indicator recorded three consecutive months of m / m increase, reaching 92.3 in July, mostly on the back of strong consumer and manufacturing sentiment. The smoothed CEIC Leading Indicator grew for a second month in a row, to 79.3 giving hope Japan has entered the expansion phase of the business cycle.
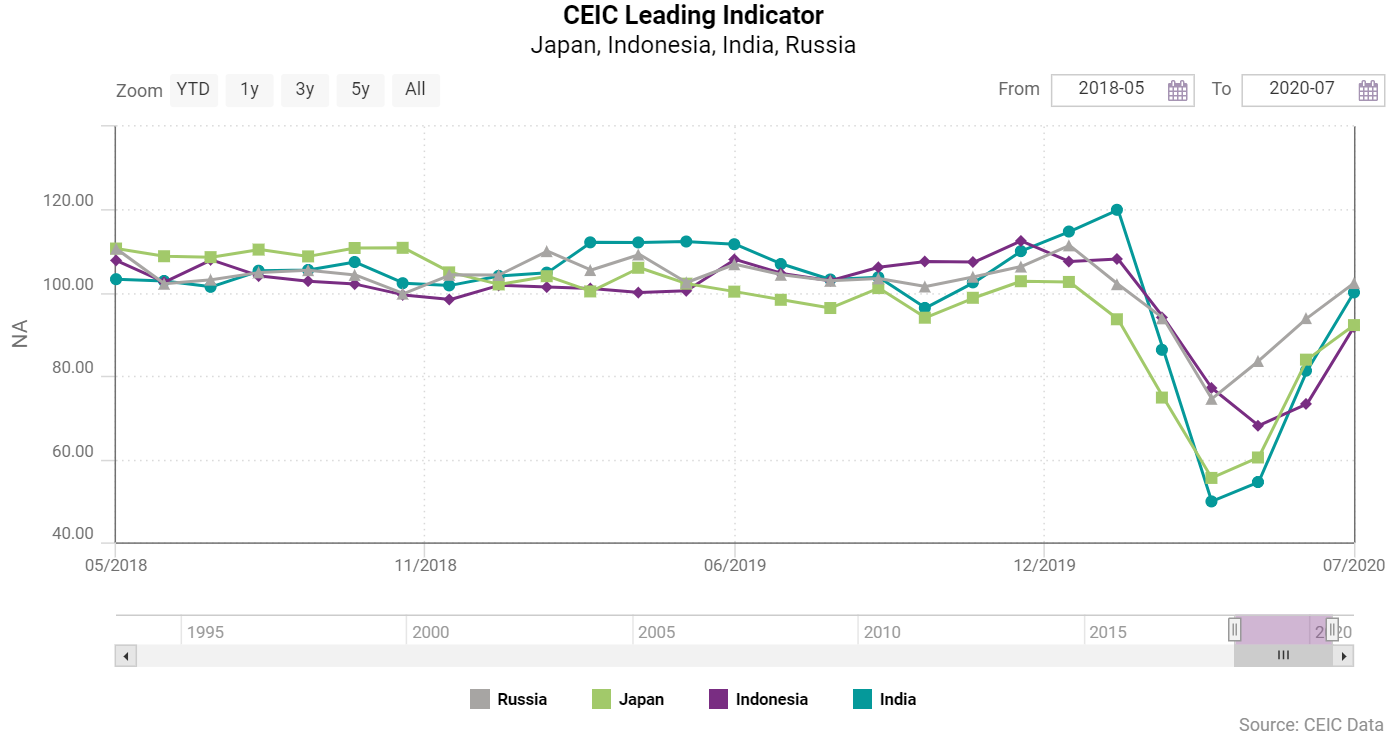
The CEIC Leading Indicator for India climbed to 100.1 in July 2020 from 81.3 in June, and the steady improvement in the economy after the easing of the lockdown has also brought about a turnaround in the smoothed CEIC leading Indicator. Steel production, electricity generation, and vehicle sales continue to remain the drivers of this increase in the actual indicator as compared to the financial indicators such as money supply and equity indices. The decline in finished steel, and crude steel production decelerated further to 21.5% y / y and 20.1% y / y, respectively, in July from 31.2% y / y and 26.3% y / y in June. Automobile sales have undergone a V-shaped recovery post lockdown, and the rate of decline narrowed to 26.4% y / y in July against 57.7% y / y in June. The wholesale price index for food has also increased from 3% y / y in June to 4.3% y / y in July. The smoothed CEIC leading Indicator increased from 78.3 in June to 79.8 in July. The indicator had been undergoing a consistent decline since May 2019. This turnaround is suggestive of a recovery of the Indian economy, and an overall positive momentum and can be attributed to the strong revival of the various sectors as a result of the government stimulus and other reforms.
Despite the double hit of the oil price war with Saudi Arabia and the COVID-19 spread which exposed weaknesses in Russia's healthcare system, the country's economy managed to sustain a robust pace in the early months of 2020. The worst drop of the non-smoothed CEIC Leading Indicator occurred in April but the value of 74.5 was among the highest between the observed regions and did not drop as much as during the Great Recession of 2008-09 and the Russian Currency Crisis of 1997-98. The indicator increased strongly since then, driven by a recovery in automobile sales, improving manufacturing production tendency and a recovery of crude oil prices, with the oil sector being of critical importance for Russia's exports. Moreover, similar to the Euro Area and Japan, Russia entered its second month in a row of smoothed indicator growth.
Keep informed each month on the predicted turning points of the economic cycle for key markets with our free, proprietary CEIC Leading Indicator. Learn more and register here