-png.png?width=747&name=shutterstock_1864033456%20(1)-png.png)
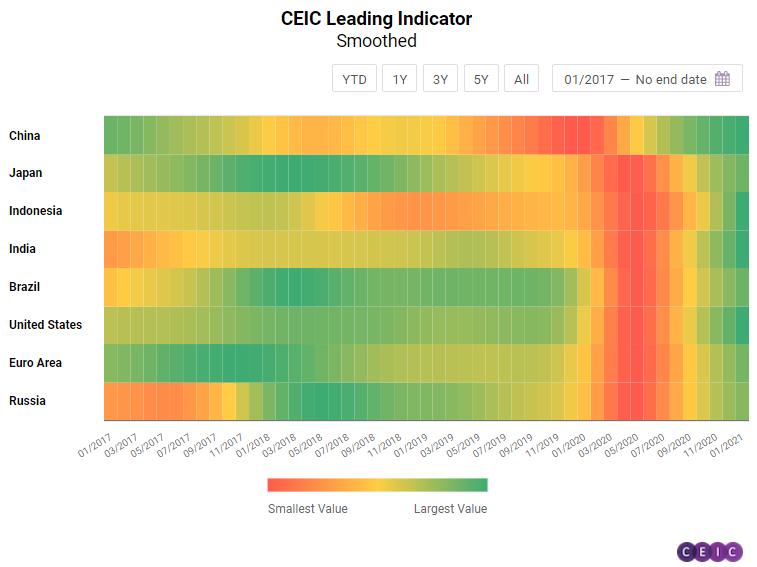
The CEIC Leading Indicator is a proprietary dataset designed by CEIC Insights to precede the development of major macroeconomic indicators and predict the turning points of the economic cycle for key markets. It is a composite indicator which is calculated by aggregating and weighting selected leading indicators covering various important sectors of the economy, such as financial markets, the monetary sector, labor market, trade and industry. It is developed through a proprietary CEIC methodology and employs data from the CEIC database. The CEIC Leading Indicator currently covers eight regions - Brazil, China, India, Indonesia, Russia, the Euro Area, Japan and the United States.
The world economy entered 2021 with the hope that a sustainable recovery would be achieved after the heavy shock caused by the COVID-19 pandemic and the restrictive measures put in place to contain the spread of the virus. The CEIC Leading Indicator data for January revealed that while most of the surveyed economies were comfortably above the threshold value of 100, there is a visible moderation in the short term acceleration of their business cycle. Only India and Indonesia continued expanding while the rest of the countries registered mostly small monthly declines.
China: Slight Moderation Ahead of the Chinese New Year
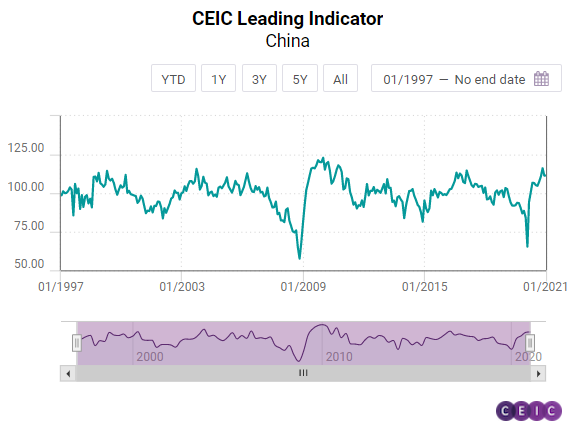
The CEIC Leading Indicator for China stabilised at the beginning of 2021 with the reading slightly going up from 111.40 in December 2020 to 111.45 in January 2021. China's GDP went up by 6.5% y/y in Q4 2020, in line with the expansion of the indicator in Q3-Q4 2020.
Broad M2 money supply grew by 9.4% y/y in January, slowing down from a 10.1% y/y growth in December 2020. After a marginal decline in December 2020, financial institution deposits climbed again to RMB 216tn, growing by 1.7% m/m in January. Ahead of the Lunar New Year, manufacturing confidence continued to decline for a second consecutive month. January’s reading stood at 51.3, down by 0.6 from December 2020, showing that the overall recovery in manufacturing continued at a slower pace. The manufacturing PMI for small enterprises, however, was still below the 50 benchmark, revealing the pressure on those businesses.
The smoothed CEIC Leading Indicator for China continued its upward trend and rose to 113.44 in January, the highest level since mid-2010, signalling the continued recovery of the Chinese economy in H1 2021.
US, Euro Area and Brazil: A Small Step Back
The US, Euro Area and Brazil all posted decreases in the first month of the calendar year although the three economies are still performing above their long-term trend and are poised for robust growth in 2021.
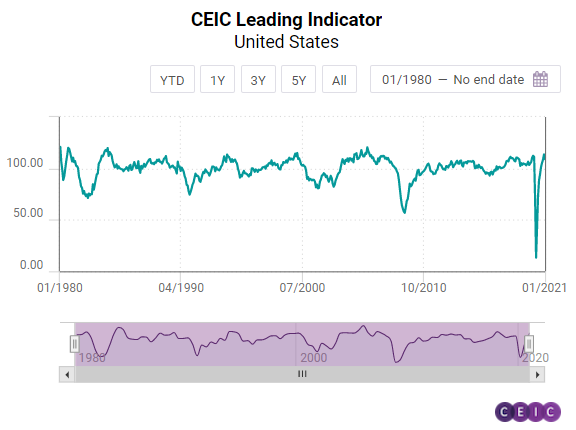
After eight months of continuous growth, the US CEIC Leading Indicator recorded its first month of decline, dropping to 109 in January 2021 from 113.6 in December. Financial markets had a slow month and the S&P 500 index fell by 3.3% m/m on the back of the unexpected GameStop short squeeze and worries due to the new South African strain of the coronavirus. Motor vehicle sales declined by 3.6% y/y while manufacturing PMI fell to 58.7 from 60.5 in December. On the other hand, capacity utlilisation is still on the rise and reached 75.6%, almost regaining its pre-pandemic level.
The CEIC Leading Indicator for the Euro Area has been showing signs of volatility since September 2020 although it still remains above the threshold level of 100. The January reading stood at 103.5, 2.5 points below the December value. Manufacturing continued to improve across the eurozone members as PMI rose to 50.9, faring above 50 for the first time since April 2019. The manufacturing industrial confidence indicator also performed strongly and had its first positive month since November 2018, at 0.4pp m/m. Consumer expectations, however, were less optimistic while the financial markets registered losses in January.
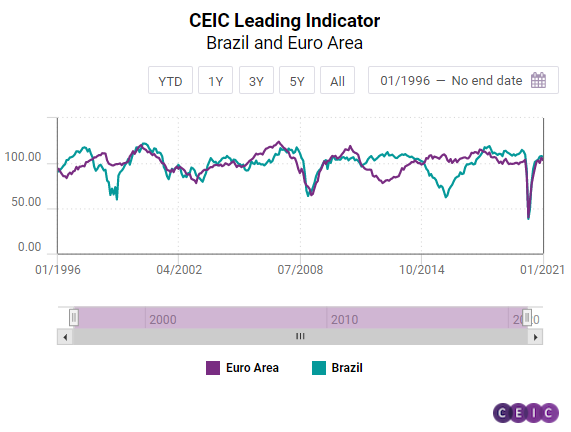
The CEIC Leading Indicator for Brazil inched down to 105.1 in January 2021 from 105.9 in December in an environment of rising COVID-19 cases in the country and delayed acquisition of vaccines. The index remains higher than the benchmark value of 100, meaning that the economy may grow moderately in Q3 2021. The manufacturing confidence indicator slipped to 11.3 in January 2021 after reaching a ten-year record of 14.9 in December, reflecting the end of the major income transfer programme – the emergency aid – and the risk that local governments may reintroduce social distancing measures to control the accelerated spread of COVID-19 infections. The consumer inflation expectation indicator remained unchanged at 5.2 in January 2021, meaning that consumers see prices unaffected by the end of the emergency aid, which may reduce substantially the purchasing power of low-income families. In the construction industry, the index measuring the expectation to purchase inputs rose to 57 from 54.5 in December 2020, well above the neutral value of 50. On the financial markets, the equity market index fell to 115,067 in the end of January 2021 from 119,017 in the end of December 2020, influenced by uncertainties regarding the local vaccination programme and the sustainability of public finances. Moreover, crude oil prices rose to a monthly average of USD 54.4 per barrel in the first month of 2021 from USD 49.2 per barrel in December 2020, reflecting a subdued global supply and a potential higher demand for fuel in the US, as the country faced a harsh winter in January 2021. In addition, the purchasing power of many Americans may increase if the US Congress approves a broader stimulus plan, which may further boost the North American demand for fuel thus pushing up oil prices.
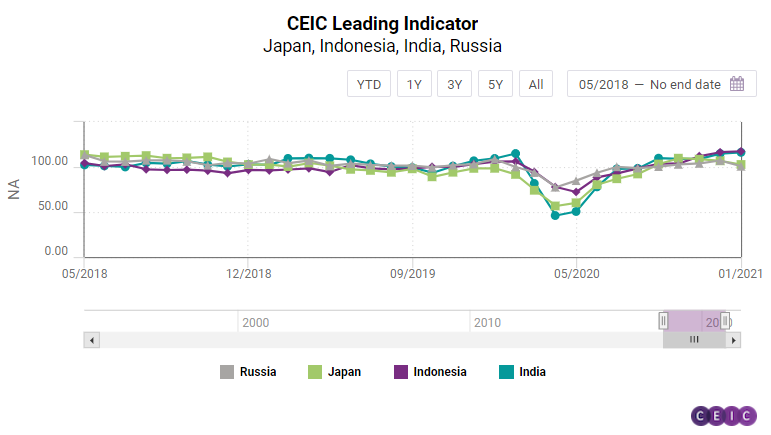
Japan, India, Indonesia and Russia: The Southeast is Booming
While the CEIC Leading Indicator for India and Indonesia reached values close to the historical peaks for these countries, Japan has been dealing with continuous moderation while Russia suffered a sharp decline that put the two countries close to the threshold value of 100.
The CEIC Leading Indicator for India increased further to 116.3 in January 2021 from 114.9 in December 2020, the highest in a decade, again driven primarily by an acceleration in monetary and financial indicators. Money supply grew by 19.5% y/y in January. The surge in stock market indices moderated in January and their end-month values were lower than in December, even though the monthly average was higher in January. The amount outstanding in 91-day treasury bills rose by 19.3% y/y in January 2021 and the yield increased to 3.4% pa, showcasing an improvement in investor sentiment in India. In terms of real indicators, an increase in electricity generation by 6.9% y/y in January also added to the increase in the leading indicator. Crude steel production and finished steel production accelerated by 7.2% y/y and 4.1% y/y, respectively, signifying a substantial improvement in industrial production. Consumer sentiment remained slightly depressed, as vehicle sales and wholesale food prices declined by 2.3% y/y and 0.3% y/y, respectively.
Recent GDP data for Indonesia showed that the country is still in recession but the development of the CEIC Leading Indicator since the last calendar quarter of 2020 suggests that recovery is upcoming. The indicator increased for the eighth consecutive month to reach 117.5 in January, the highest reading since March 2008 and currently the best performing among all observed economies. Crude palm oil price has been on the rise since May 2020 and in January it reached USD 1,033.8 per tonne, the highest in nine years. Non-oil exports decelerated slightly but are still growing robustly, by 12.5% y/y. The rupiah appreciated moderately against the USD on a monthly basis which marks the fifth month in a row of improving performance. On the other hand, the recovery in motor vehicle sales is still sluggish and growth barely accelerated from December to January.
While the CEIC Leading Indicator values for Japan are still above the threshold level of 100, the recent development has been worrying, as the indicator has been declining since October 2020. In January it lost another 4.1 points and fell to 102.8. Both corporate and consumer surveys reveal a significant drop in confidence starting from Q4 2020 and continuing into 2021. After the boom in October 2019, motor vehicle sales growth moderated considerably but is still positive unlike in many other markets worldwide. Decline in machine tool orders on the domestic market is still in the double digits, at 10.9% y/y in January, but there is a visible acceleration trend after the dismal performance in 2019 and 2020.
Russia registered the largest monthly decline in the CEIC Leading Indicator value among the observed economies, as it dropped by 6.4 points to 100.8 in January 2021, effectively erasing the gains achieved in Q4 2020. Another month of rising crude oil prices could not offset a decline in manufacturing and the automobile sector. Manufacturing production tendency declined aggressively, from 21% to -3.9%, and new automobile sales declined for the second month in a row, at 4.2% y/y, casting doubt whether recovery in the sector has been sustainable. The RTS stock exchange index declined by 1.5% y/y in January. Despite optimistic news about the efficiency of the Russian COVID-19 vaccine Sputnik V, issues with the country’s production capacity have cast doubt whether demand could be met in the short term.
Keep informed each month on the predicted turning points of the economic cycle for key markets with our free, proprietary CEIC Leading Indicator. Learn more and register here