
The CEIC Leading Indicator is a proprietary dataset designed by CEIC Insights to precede the development of major macroeconomic indicators and predict the turning points of the economic cycle for key markets. It is a composite leading indicator which is calculated by aggregating and weighting selected leading indicators covering various important sectors of the economy, such as financial markets, the monetary sector, labour market, trade and industry. It is developed through a proprietary CEIC methodology and employs data from the CEIC database. The CEIC Leading Indicator currently covers eight regions – Brazil, China, India, Indonesia, Russia, the Euro Area, Japan and the United States.
The CEIC Leading Indicator for China stabilised at the beginning of 2021 with the reading slightly going up from 111.40 in December 2020 to 111.45 in January 2021. China's GDP went up by 6.5% y/y in Q4 2020, in line with the expansion of the indicator in Q3-Q4 2020.
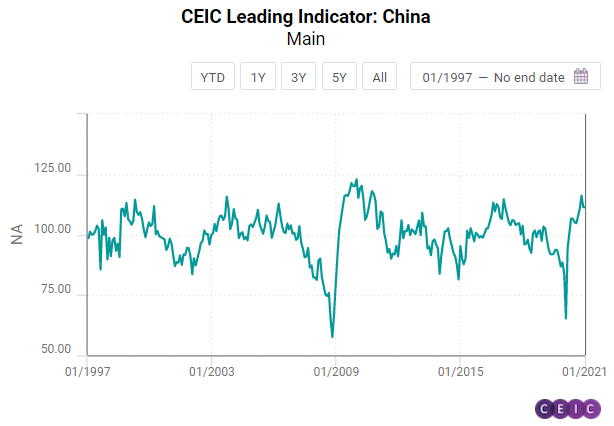
Broad M2 money supply grew by 9.4% y/y in January, slowing down from a 10.1% y/y growth in December 2020. After a marginal decline in December 2020, financial institution deposits climbed again to RMB 216tn, growing by 1.7% m/m in January. Ahead of the Lunar New Year, manufacturing confidence continued to decline for a second consecutive month. January’s reading stood at 51.3, down by 0.6 from December 2020, showing that the overall recovery in manufacturing continued at a slower pace. The manufacturing PMI for small enterprises, however, was still below the 50 benchmark, revealing the pressure on those businesses.
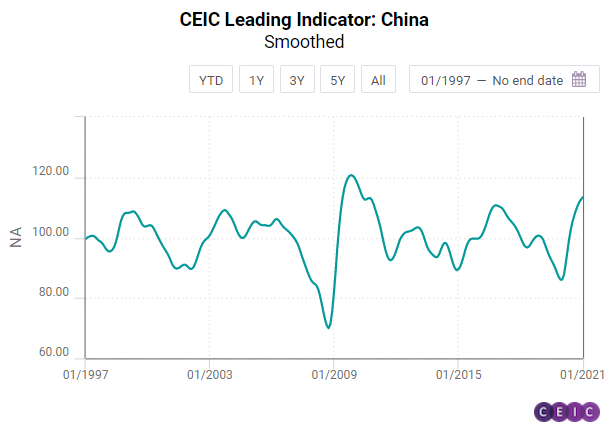
The smoothed CEIC Leading Indicator for China continued its upward trend and rose to 113.44 in January, the highest level since mid-2010, signalling the continued recovery of the Chinese economy in H1 2021.
Keep informed each month on the predicted turning points of the economic cycle for key markets with our free, proprietary CEIC Leading Indicator. Learn more and register for free here.