
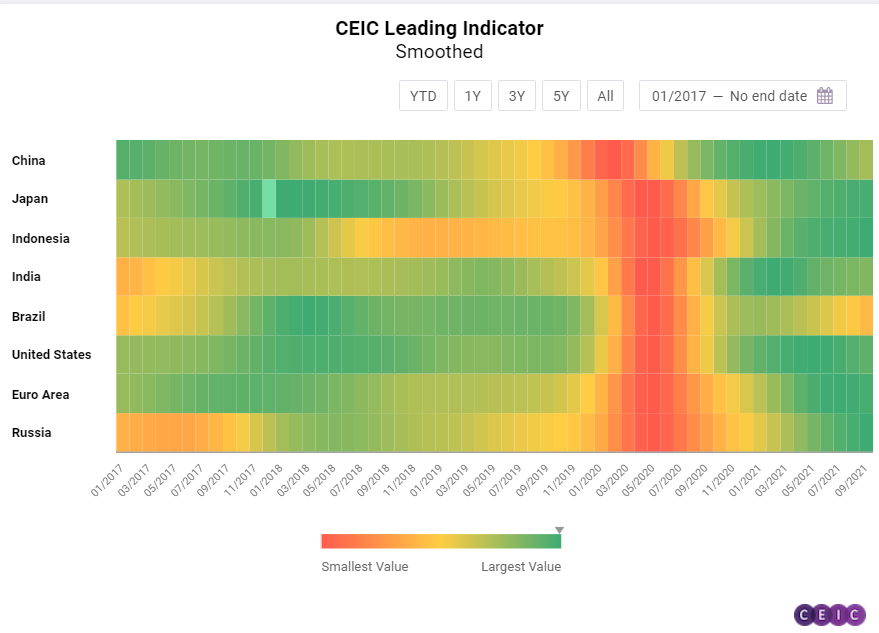
The CEIC Leading Indicator is a proprietary dataset designed by CEIC Insights to precede the development of major macroeconomic indicators and predict the turning points of the economic cycle for key markets. It is a composite leading indicator that is calculated by aggregating and weighting selected leading indicators covering various important sectors of the economy, such as financial markets, the monetary sector, labour market, trade, and industry. It is developed through a proprietary CEIC methodology and employs data from the CEIC database. The CEIC Leading Indicator currently covers eight regions – Brazil, China, India, Indonesia, Russia, the Euro Area, Japan, and the United States.
September 2021 data for the CEIC Leading Indicator offers further evidence that the surveyed economies have passed the peak of their respective business cycle but most of them are still performing comfortably above their long-term trend. The indicators for all eight regions either declined or stagnated in September compared to August, with Brazil now firmly in a downturn phase and China and India close to the threshold value of 100. The global economic recovery has been slowed down by supply chain bottlenecks and rising energy prices.
China: Economic Performance Close to Long-Term Average
The CEIC Leading Indicator for China rose marginally to 102.3 in September after five consecutive months of decline. However, it remains close to the threshold value of 100. China’s official manufacturing PMI dropped below the threshold level of 50 for the first time since February 2020, as manufacturers struggled with the surging raw material costs and ongoing power shortages. As the high base effect from last year has faded, automobile production declined by 17.72% y/y in September. Growth of money supply accelerated to 8.26% y/y in September from 8.21% in the previous month. The expansion of financial institution deposits also accelerated to 8.58% y/y from 8.29% y/y in August.
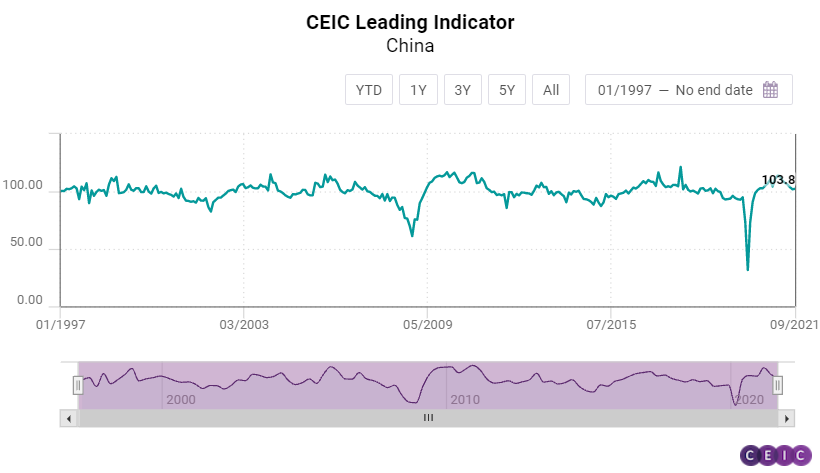
Affected by tighter regulations, China’s real estate sector continued to cool down, as floor space sold of commodity buildings in the period January-September 2021 increased by 11.33% y/y compared to 15.95% y/y growth in the period January-August 2021. The smoothed CEIC Leading Indicator fell to 101.5 in September compared to 103.1 in the previous month. The value close to 100 suggests that the economy faces increasing pressure for the rest of the year as well as in Q1 2022.
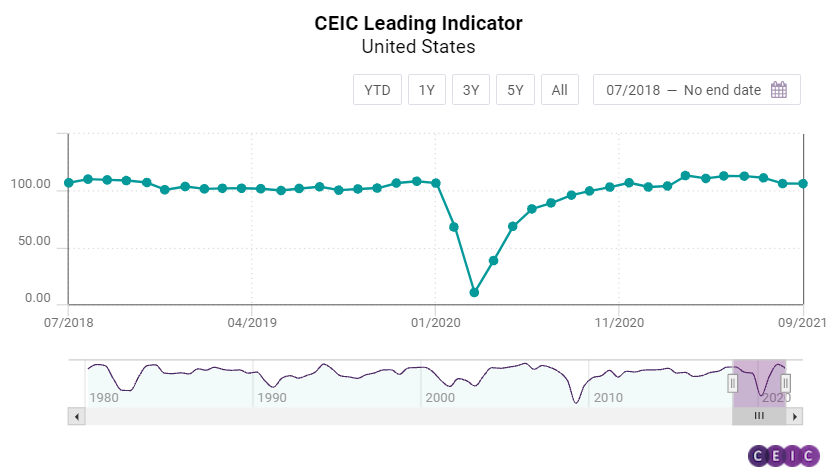
US, Euro Area and Brazil: Full Quarter of Downturn for Brazil
After the big drop in August, the CEIC Leading Indicator for the US registered a marginal decline in September, by 0.1 points m/m to 106.2. The ISM purchasing managers’ index increased for the second month in a row, to 61.1, signalling that the manufacturing sector is back on track. On the other hand, seasonally adjusted capacity utilization dropped to 75.2% from 76.2% in August. After four months of deceleration, the housing market index rebounded to 76, with preliminary October data suggesting further recovery. Motor vehicle sales continued to plummet, decreasing by 24.3% y/y, the worst performance since the first lockdown in Q2 2020. Consumer confidence deteriorated in September, dropping to 109.3 from 115.2 in August. The S&P 500 index declined for the first time since January 2021, by 4.9% m/m.
In the eurozone, the business cycle has likely passed its peak as the CEIC Leading Indicator declined for the fourth month in a row. Nevertheless, the values for the Euro Area continue to be among the highest in the observed economies. In September, the CEIC Leading Indicator dropped to 111.2 from 113.2 in the previous month. The employment component of the manufacturing PMI decreased for the second month in a row to 55.4. The growth of the basic metals component of the industrial confidence indicator also decelerated compared to August, increasing by 17.6pp. Similar to its US counterpart, the Dow Jones Euro Stoxx index also declined for the first time since January, losing 3.6% m/m. Nevertheless, eurozone consumers remain relatively optimistic about their financial situation over the next 12 months, with perceptions improving by 1.5pp compared to 1pp in August.
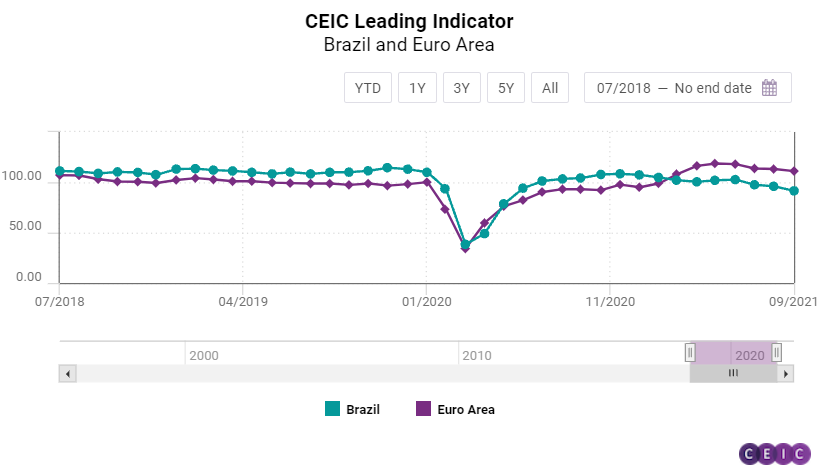
After recording a four-month high of 102.7 in June, the CEIC Leading Indicator for Brazil fell to 91.5 in September, below the threshold of 100 for the third straight month. The struggling labour market and the rising inflation, amid a severe energy crisis, hamper hopes for a substantial GDP growth after the pandemic, and thus the biggest economy in Latin America may see subdued economic activity in 2022. The equity market index Ibovespa fell to 110,979 in the end of September from 118,781 in the end of August. The heated construction industry may slow down in the next months, as the expectation to purchase inputs index slipped to 55.1 in September from 55.9 in August 2021. The consumer inflation expectation indicator peaked at 7.7 in September, supported by higher prices of electricity, food, and fuels. The international crude oil prices rose to a monthly average of USD 73.9 per barrel in September from USD 70.3 per barrel in August. The manufacturing confidence indicator dropped to 6.4% in the ninth month of the year from 7% in August, which can be explained with the global shortage of parts and components and with inflationary pressures.
Japan, India, Indonesia and Russia: India Hit by Global Energy Crisis
The CEIC Leading Indicator for Japan stagnated in September, dropping marginally to 110.95 from 111.2 in the previous month. While the indicator declined for the third month in a row, the value is still way above the threshold of 100, which separates expansion from downturn, and suggests that Japan is still performing above its long-term trend. The massive decline in motor vehicle sales, which fell by 32.2% y/y, had the most devastating effect on the performance of the leading indicator. However, a strong domestic demand for machine tools managed to mostly offset this decline in September. Moreover, survey data suggested that both households and corporates had an improved outlook for September compared to August. Japan’s TOPIX small index also hit an all-time high in September, closing the month at 2,456.11 and gaining 3.1% m/m. OECD’s CPI based real effective exchange rate (REER) also declined marginally, suggesting that Japanese trade competitiveness has improved slightly on a monthly basis.
India’s CEIC Leading Indicator underwent a sharp decrease in September, to 103.3 from 112.7 in August. The decline comes after three consecutive months of increase and is driven primarily by a drop in gross electricity generation by 1.7% y/y, the first decline since August 2020, fuelled by the ongoing global energy crisis. Vehicle production, which had been slowing since April due to dissipating low base effects, decreased in September by 37.5% y/y, from a growth of 5% y/y in August, which also contributed significantly to the fall in the CEIC leading indicator. Finished steel production growth moderated to 4.7% y/y in September 2021 from 5.5% y/y in August. Similarly, the wholesale price index for food slowed down significantly by 2.3 pp to 1.1% y/y in September but had virtually no impact on the leading indicator. The reduction in the CEIC Leading Indicator can also be attributed to a sustained deceleration of growth in money supply, M2, since June 2021, to 11.2% y/y in September 2021. On the other hand, other financial indicators such as equity markets and treasury bills have contributed positively to the leading indicator. Equity markets touched new record highs in the month of September, with the Bombay Stock Exchange closing at 59,126.4, in comparison with 57,552.4 in August, averaging at 58,781 over the month. The 91-day treasury bills yield increased to 3.45% pa by 0.05 bps in September.
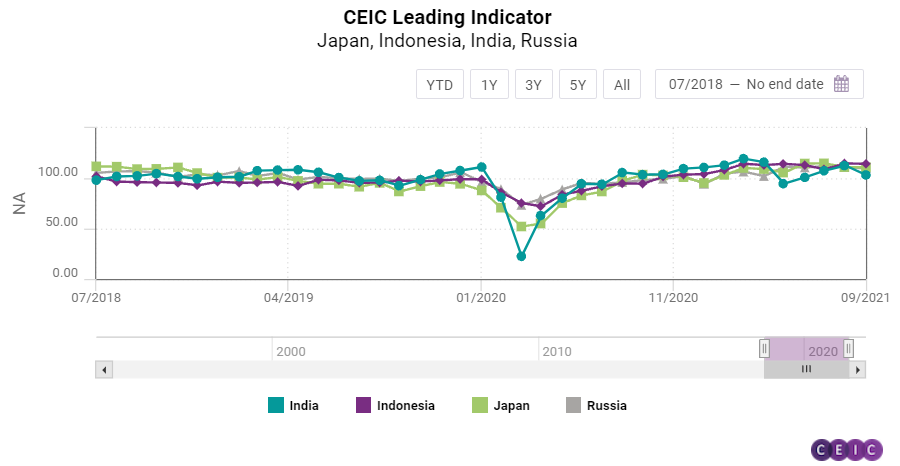
Despite a minor decline in September, the CEIC Leading Indicator for Indonesia continues to be the best performing among the observed regions. The non-smoothed indicator declined to 114.4 from 114.8 in the previous month. Palm oil prices continued to rise, averaging USD 1,269.1 per tonne, close to the historic peak registered in May. This contributed to another strong month of non-oil and gas exports’ value growth, which hit 48% y/y in September. Unlike many other markets, sales of motor vehicles in Indonesia continued to grow robustly, increasing by 73.2% y/y on the back of the extension of the tax discount for motor vehicles until December 2021. The Jakarta composite stock exchange index closed September at 6,286.9, managing to finally regain its losses since February 2021. Domestic cement consumption also increased for the seventh month in a row, growing by 3.9% y/y.
The CEIC Leading Indicator for Russia dropped by 1.3 points m/m to 109.8 in September but continued to be relatively stable and avoiding big fluctuations since May 2021. As in other economies, the low base effect from 2020 has worn off and domestic motor vehicle sales declined for the third month in a row, by 22.6% y/y in September. The OPEC spot crude oil price averaged USD 73.9 per barrel in September, the highest since October 2018, which would boost Russian exports’ value. Manufacturing production tendency improved for the fifth month in a row, hitting 27.5% in September, the highest since May 2007. The RTS stock exchange index closed September in a strong fashion, gaining 5.3% m/m.
Keep informed each month on the predicted turning points of the economic cycle for key markets with our free, proprietary CEIC Leading Indicator. Learn more and register here