
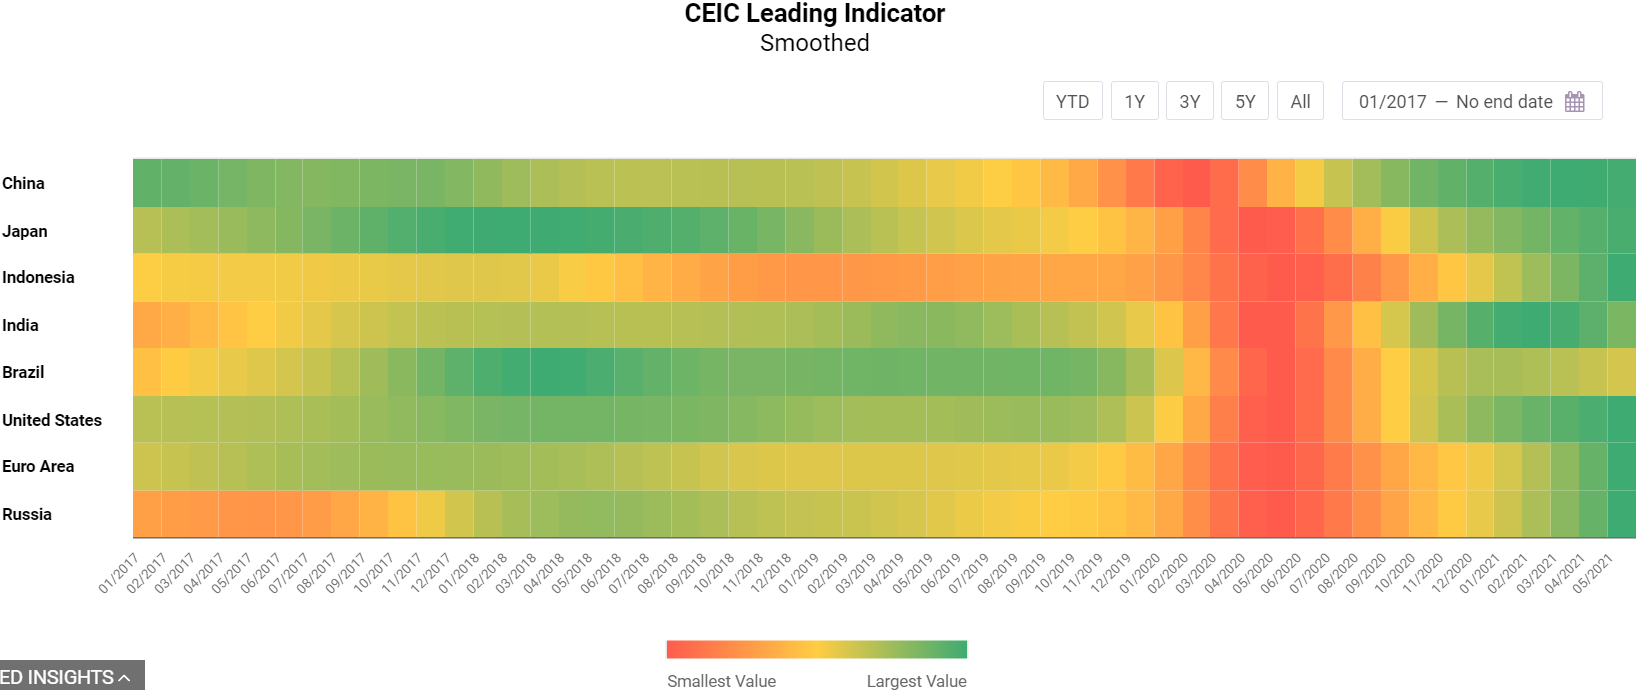
The CEIC Leading Indicator is a proprietary dataset designed by CEIC Insights to precede the development of major macroeconomic indicators and predict the turning points of the economic cycle for key markets. It is a composite leading indicator that is calculated by aggregating and weighting selected leading indicators covering various important sectors of the economy, such as financial markets, the monetary sector, labour market, trade and industry. It is developed through a proprietary CEIC methodology and employs data from the CEIC database. The CEIC Leading Indicator currently covers eight regions – Brazil, China, India, Indonesia, Russia, the Euro Area, Japan and the United States.
May 2021 data for the CEIC Leading Indicator reveals that the threat of further COVID-19 outbreaks is still a leading concern regarding the recovery of the surveyed economies. The indicator values for countries where the pandemic was a significant factor, such as India and Japan, showed visible deterioration, whereas the Euro Area is undergoing an unprecedented rebound. Indonesia continues to perform high above the long-term average while some positive signs in Brazil raise hope that the country is going back on track after the setbacks since the beginning of 2021.
China: Economic Recovery Enters More Stable Phase
The CEIC Leading Indicator for China plunged further to 109.1 in May, marking the second straight month of decline. The value is still over 100, suggesting that the economy is performing above the long-term trend. However, starting from April, we saw China’s economic recovery entering a more stable phase, as suggested by the moderation of key variables under the CEIC Leading Indicator. The manufacturing sector faced downward pressure among weak domestic demand, surging raw material prices and global supply chain disruptions.
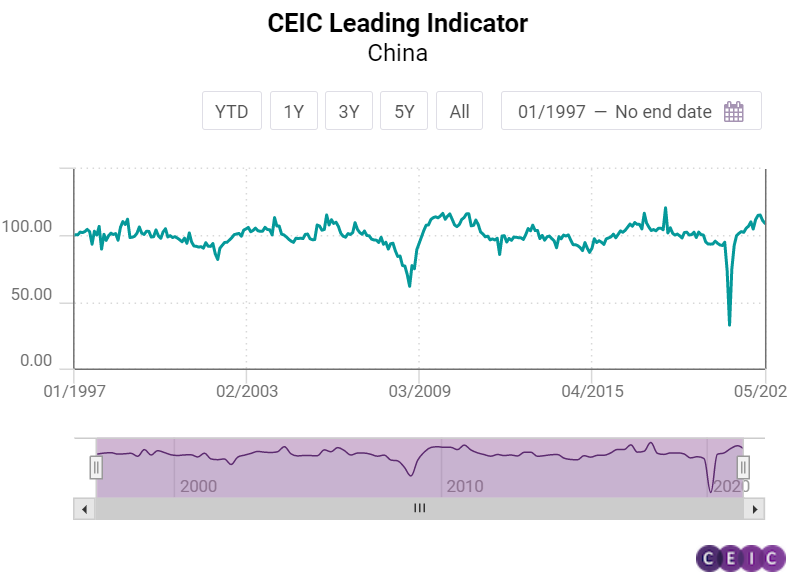
China’s manufacturing PMI dropped slightly in May to 51, still above the 50 threshold and indicating expansion. Automobile production ended 13 months of positive y/y growth and registered a 6.74% y/y decline in May. The slowdown in credit growth stabilized as policymakers tried to avoid sharp policy turns. In May, money supply M2 increased by 8.35% y/y, matching the pace in April. The growth rate for financial institution deposits barely changed in May. In the first five months of 2021, China’s utilized FDI grew by 39.78% y/y, slightly below the first four months, maintaining its sound pace. The real estate sector sees signs of cooling. From January to May, floor space sold of commercial buildings increased by only 36.3% y/y, a sharp decline from the 48.08% y/y growth rate from January to April.
US, Euro Area, and Brazil: Eurozone Well Ahead, Brazil Resurgent
The latest data for the CEIC Leading Indicator reveals that the three economies hit most savagely by the first coronavirus wave in April 2020 have all posted m/m increases. However, while the US and the Euro Area are way above the threshold value of 100, Brazil’s recovery is more troubled.
After declining slightly in April 2021, the CEIC Leading Indicator for the US returned to acceleration in May, registering a 1.2 point increase to 115.9. Capacity utilisation approached pre-pandemic levels in May, rising to 75.2% compared to 76.3% in February 2020. Sales of motor vehicles accelerated on a monthly basis by 3.1% whereas the annual growth amounted to 41.9% but the low base effect from the May 2020 manufacturing freeze should be taken into account. The Purchasing Managers’ Index recovered moderately, growing to 61.2 in May from 60.7 in the previous month.
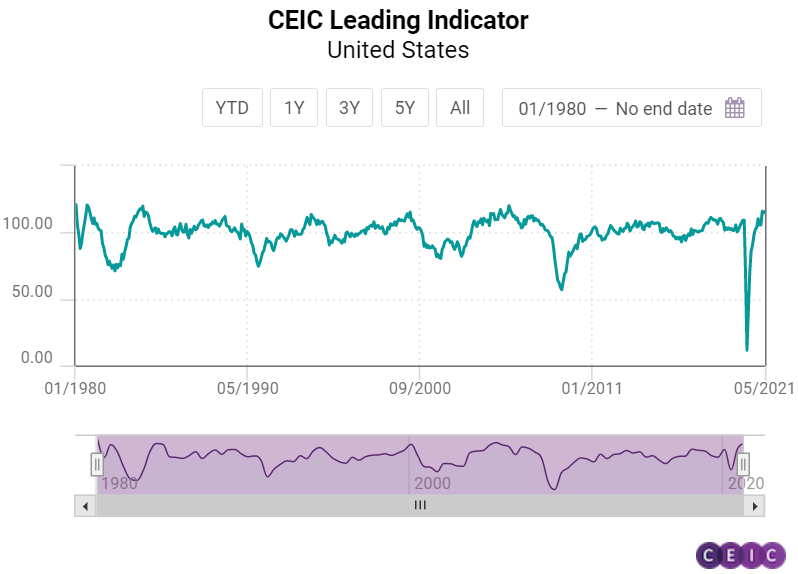
The labour market is also in recovery, with the initial unemployment insurance claims at their lowest level since the start of the pandemic. The average weekly overtime hours also increased to 4.2 in May from 4.1 in April. The US housing market index has been moderating since its peak in November 2020 but the May value is still high, at 83. At the same time, private housing units started to rise to 143,100 in May, from 135,800 in the previous month, but the current housing market supply cannot match the demand, bringing house prices to historic highs.
The CEIC Leading Indicator for the Euro Area hit an all-time high of 123.97 in May, revealing that the recovery in the eurozone is at full speed. Inflation hit the 2% ECB target in May for the first time since 2018 as economies started gradually lifting coronavirus restrictions, thus bolstering demand. Industrial confidence registered another jump, increasing by 22.5 pp, the second-best performance on record. The employment index in manufacturing is also approaching an all-time peak, rising to 57.7, close to the record of 58.2 in December 2017. Consumer confidence registered positive growth for the second month in a row, rising by 1.6 pp, and is currently at February 2020 level.
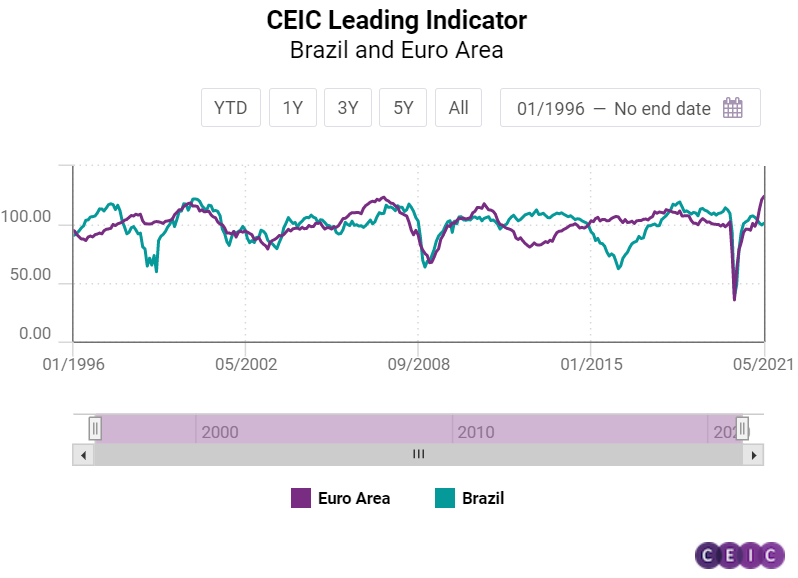
The economic activity in Brazil may accelerate in the fourth quarter of 2021, as the country’s CEIC Leading Indicator exceeded the threshold of 100, standing at 101 in May. It means that the country’s economy may grow slightly above the long-term trend from October 2021, as the bulk of the population is expected to be vaccinated until then, which would bring back the demand for many face-to-face activities, particularly in the services sector. Some key variables supported the performance of the CEIC Leading Indicator in May. The manufacturing confidence indicator rose to 4.2% in the month, after falling for four months in a row, reflecting the improved prospect for economic recovery on a global scale, which may have a positive impact on Brazilian exports.
The demand for construction remains high in the country, as the expectation to purchase inputs index increased to 54.9 in May from 51.7 in April 2021. The consumer inflation expectation indicator reached 5.9 in May, the highest figure in forty-two months, as the prices of fuels and energy in the country have been growing. Notably, international crude oil prices rose to a monthly average of USD 66.9 per barrel in May from USD 63.2 in April. In the stock markets, the equity market index rose to 126,216 at the end of May from 118,893 at the end of April, supported by a growing number of vaccinated people.
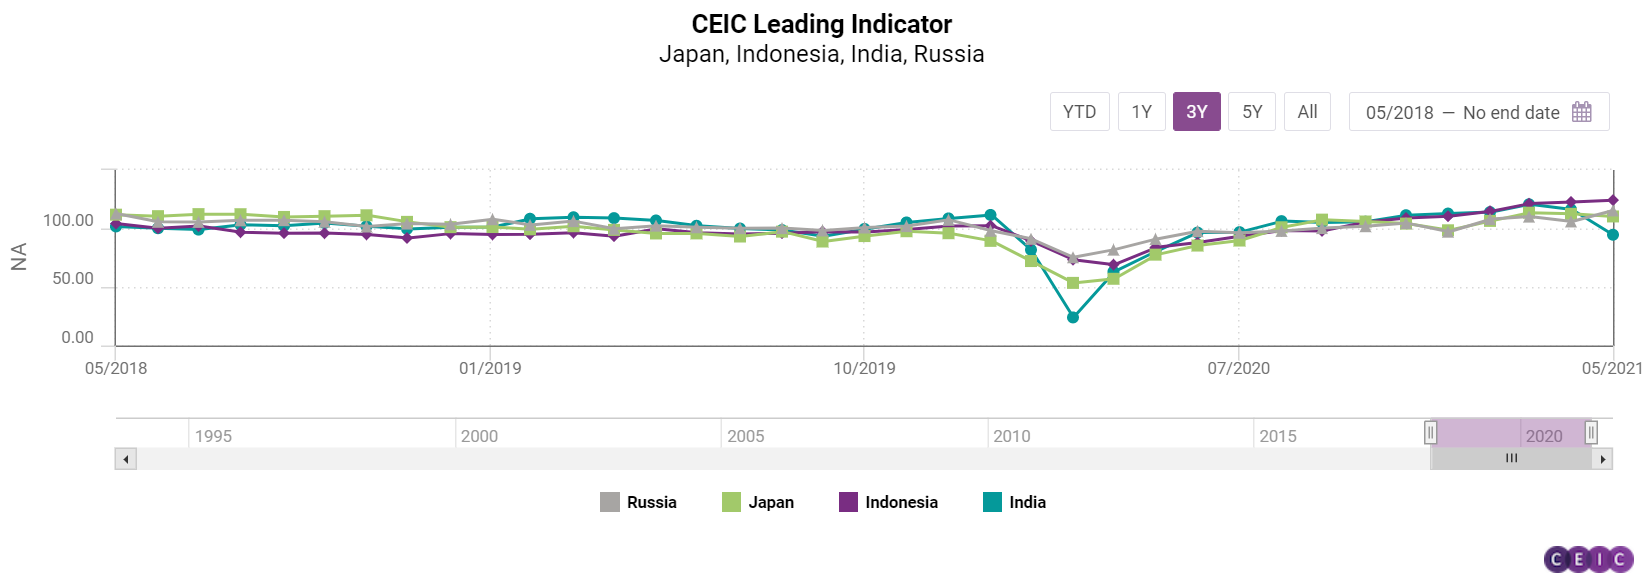
Japan, India, Indonesia, and Russia: India Devastated by Second COVID Wave
The CEIC Leading Indicator for Indonesia remained the strongest performer among all surveyed economies for yet another month in May, while India recorded a huge setback due to the second wave of coronavirus infections in the country. Russia registered a large increase while Japan’s leading indicator declined on a monthly basis for the second month in a row.
The second COVID-19 wave in India had a devastating effect on the economy, as the CEIC Leading Indicator for India shows. The indicator dropped sharply to 94.7 in May 2021 from 116.3 in April as the country suffered record-high infections and mortalities due to the coronavirus. Motor vehicle production decelerated rapidly in May, dropping to 128,225 units from 305,952 in the previous month. Electricity generation also declined by 11% m/m and has decelerated on an annual basis, although growth is still present. The yield for 91-day treasury bills accelerated slightly to 3.4% pa, from 3.32% pa in April while the amount outstanding increased by 25.3% y/y. Growth in money supply continued to decelerate, dropping to 14.3% y/y. Nevertheless, the Bombay Stock Exchange closed at a peak 51,937.4, gaining 3,155.1 points compared to the previous month. Food inflation moderated in May, with wholesale food prices’ growth decelerating to 4.3% from 4.9% in April.
The development of the smoothed CEIC Leading Indicator is also a cause of concern as it declined for the third month in a row to 107.5 in May. Although the value above 100 signifies that the economy is still performing above the long-term trend, there are signs that the business cycle of India has probably passed its peak and is in a state of moderation. Different parts of the country are still under lockdown, which is bound to affect the economy adversely, even though the low base impact lingers on from the nationwide lockdown in the previous year.
The CEIC Leading Indicator for Indonesia continued to increase, reaching a record high of 124.2 in May, a monthly increase of 1.5 points. The post-pandemic boom of palm oil prices continued in May and reached USD 1,279.1 per tonne, a record high for one of the key Indonesian exports and an increase of 176.1% y/y. The Indonesian rupiah registered a minor gain against the USD in May, dropping to IDR 14,310 per USD from IDR 14,468 in April.
Motor vehicle sales, on the other hand, decreased on a monthly basis, falling to 54,815 units from 78,908 in April, although the extension of the luxury tax break for certain vehicles is expected to keep the vehicle market afloat. Non-oil and gas exports declined by 11.9% m/m in May, for the first time since February 2021, but increased by a massive 58.3% y/y due to the low base effect from last year’s pandemic situation.
The CEIC Leading Indicator for Japan registered its second monthly drop in a row, decreasing by 2.2 points to 110.3 in May. Similarly to the previous month, both consumer confidence and manufacturing sentiment declined, which can be attributed to prolonged lockdown measures in the country. The TOPIX Small index mirrored this sentiment, as it also posted losses for the second month in a row, albeit by a mere 0.3% m/m. Both motor vehicle sales and domestic machine tool orders declined on a monthly basis but increased largely y/y due to the low base effect from the previous year. Given the precarious situation with the COVID-19 restrictions in the country, there are further doubts whether the Tokyo Summer Olympic games would be held in 2021, which might have an adverse effect on Japanese recovery.
The development of the CEIC Leading Indicator for Russia has been uneven since the beginning of the year. After a drop in April, the indicator rose sharply in May, by 9.4 points to 115.4, the largest m/m increase among the surveyed economies. Crude oil prices returned to growth in May rising to USD 66.9 per barrel, the highest average monthly price since May 2019. Manufacturing production tendency was also back on a positive trend, rising by 11.6%. Domestic sales of new vehicles declined by 3.4% m/m but posted large annual increases similarly to other major economies.
The total amount of new vehicles sold stood at 147,378, close to the pre-pandemic performance. The RTS stock exchange index closed in May with a significant gain of 7.6% compared to April due to the positive development of oil prices and expectations over the first meeting between US and Russian presidents scheduled for June.
Keep informed each month on the predicted turning points of the economic cycle for key markets with our free, proprietary CEIC Leading Indicator. Learn more and register here