-png.png)
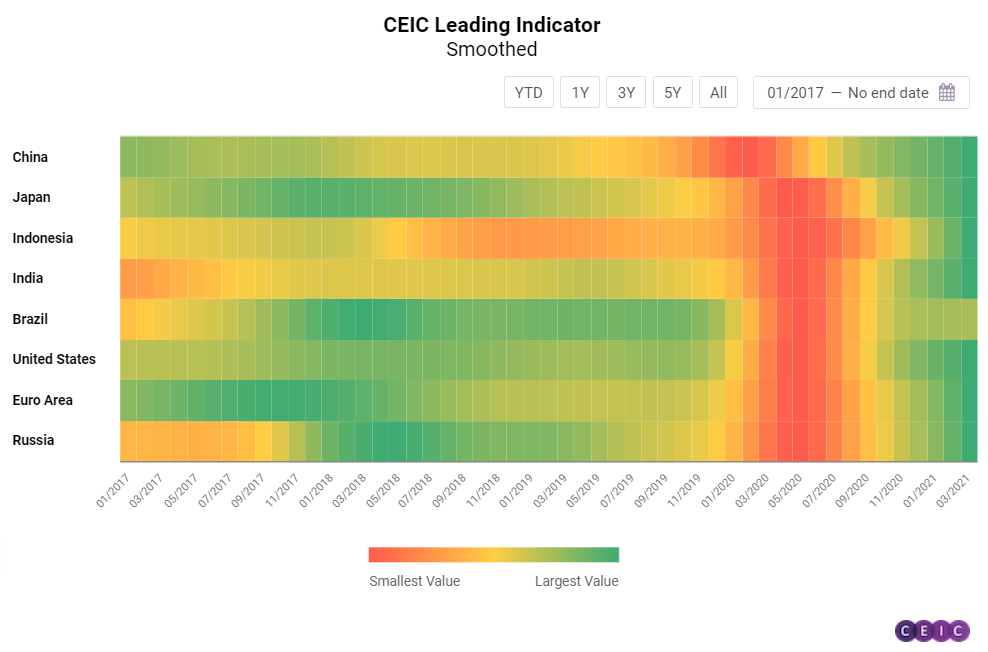
The CEIC Leading Indicator is a proprietary dataset designed by CEIC Insights to precede the development of major macroeconomic indicators and predict the turning points of the economic cycle for key markets. It is a composite indicator that is calculated by aggregating and weighting selected leading indicators covering various important sectors of the economy, such as financial markets, the monetary sector, labour market, trade and industry. It is developed through a proprietary CEIC methodology and employs data from the CEIC database. The CEIC Leading Indicator currently covers eight regions - Brazil, China, India, Indonesia, Russia, the Euro Area, Japan and the United States.
The development of the CEIC Leading Indicator in Q1 2021 has shown that the majority of the surveyed countries are in a phase of strong rebound from the devastating shock of the COVID-19 pandemic. The March 2021 values were among the highest on record – an outcome that can be explained with rising optimism about the economic resilience one year after the pandemic and the ongoing progress of the vaccination process.
China: Growth Prospects Solid as Ever
The CEIC Leading Indicator for China closed Q1 2021 with a strong performance in March. The non-smoothed indicator increased to 117.5 in March from 116.4 in the previous month. While this value is not recorded high, the solid trend suggests that the overall performance might be the strongest recorded since 1997, as the previous peaks were likely outliers. The development of the indicator was backed by positive signals from the manufacturing sector. Manufacturing PMI increased on a monthly basis for the first time since November 2020, jumping to 51.9% in March from 50.6% in February 2021. The automobile sector continues its recovery and car production increased by 73.1% y/y in March 2021, although the low base effect from the COVID-ridden previous year should be taken into account. The situation in the real estate sector is also improving, as the floor space sold in the period between January and March 2021 increased by 63.8% compared to the same period of 2020. The monetary policy continues to be accommodative, with the money supply increasing by 9.4% y/y in March, although there is a slight deceleration from the 10.1% y/y growth in the previous month.
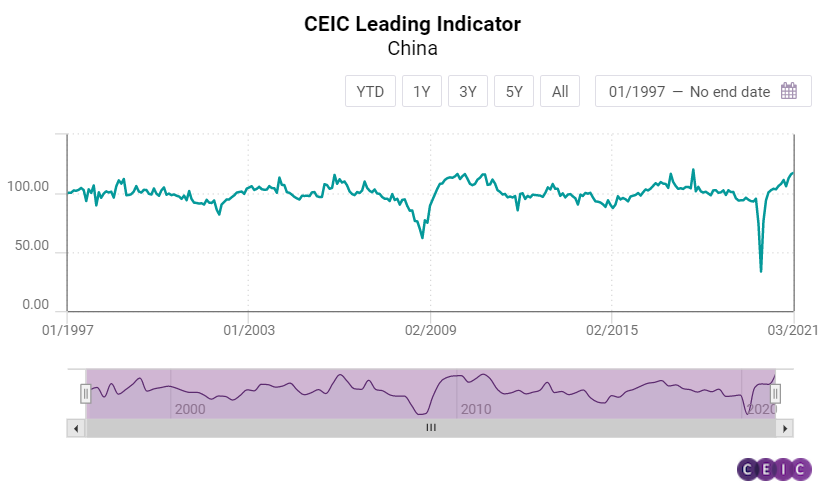
The smoothed CEIC Leading Indicator rose to 117.2 in March 2021 and is currently at its highest level on record. The continuous strong performance of the smoothed indicator since March 2020 foreshadowed the economic recovery of China in the aftermath of the COVID-19 crisis and is in line with the latest GDP figures, which revealed a Q1 2021 growth of 18.3% y/y.
US, Euro Area and Brazil: Brazil Straying from the Pack
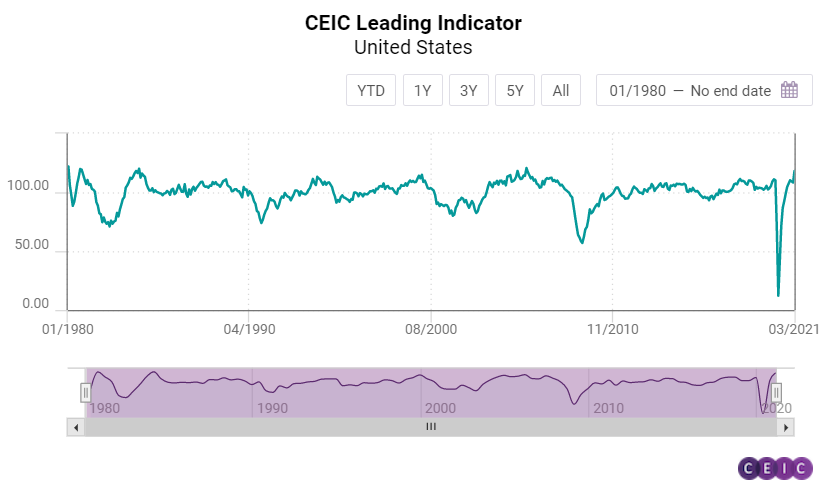
Unlike the Euro Area and the US, which posted values close to historic peaks in March 2021, the CEIC Leading Indicator in Brazil is in decline, unique among the surveyed economies.
The CEIC Leading Indicator for the US rose by 9.8 points m/m from February to March 2021, reaching 118.2, its highest value since January 2006. A total of 1.6mn motor vehicles were sold, which meant a 58.4% growth compared to the COVID-19 affected March 2020 and a return to pre-pandemic levels. The S&P 500 index closed the month of March gaining 4.2% m/m on the back of the continuing accommodative Fed policy and optimism about the progress of the COVID-19 vaccination. After the slip-up in February, capacity utilization returned to its end-2020 levels, at 74.4%. Manufacturing PMI also surged to 64.7 in March from 60.8 in the previous month. The construction sector is booming, with private housing starts increasing by 38.2% y/y and currently at their highest level after the financial crisis of 2007-2008.
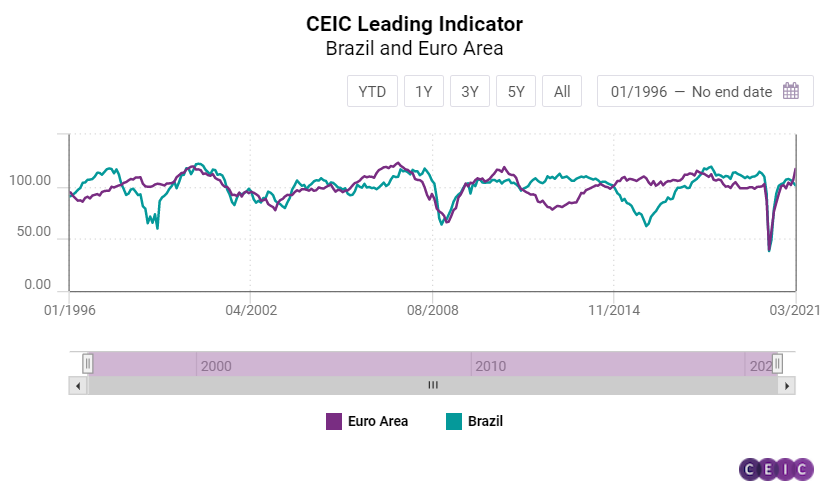
After a rather volatile end of 2020, the CEIC Leading Indicator for the Euro Area soared in Q1 2021, and its March value reached 117, a monthly increase of 10.4 points and the highest level since February 2011. Favourable sentiment persisted in the eurozone due to the resilient economic performance and the rising vaccination rate among its members. Consumer confidence is accelerating with eurozone consumers assessing their financial situation over the next 12 months at the highest level since February 2020. Confidence in the industrial and construction sectors is also improving. The Dow Jones Euro Stoxx index closed March at its highest level since June 2007. Manufacturing PMI jumped by 3.3 points m/m to 54.8, the highest reading since August 2018.
Brazil is going through yet another wave of rising COVID-19 infections, which was reflected in the performance of the CEIC Leading Indicator for March 2021. The non-smoothed value of the indicator fell to 101.3, dropping close to the threshold of 100. The development of the smoothed CEIC Leading Indicator might be even more worrisome, as it registered a monthly decline for the second time in a row, suggesting that Brazil could be past the peak of the business cycle and entering a period of decline. The manufacturing confidence indicator recorded its third fall in a row to 4.2% in March 2021, seasonally adjusted, due to the high numbers of COVID-19 infections and deaths which had an adverse effect on new orders and production output for firms in the sector. In the construction industry, the expectation to purchase inputs index slipped for the second month in a row, to 52.4 from 55.3 in February 2021, approaching the neutral value of 50. The inflation expectation index rose for the third time in a row, reaching 5.5 driven by an increase in production costs and the ever-increasing prices of fuels. International crude oil prices rose to a monthly average of USD 64.6 per barrel in March 2021, from USD 61.1 in the previous month.
Japan, India, Indonesia and Russia: Approaching the Peak
Japan, Indonesia, and India had another month of strong acceleration in March 2021, while the CEIC Leading Indicator for Russia also performed robustly although in a more subdued manner compared to the other three economies.
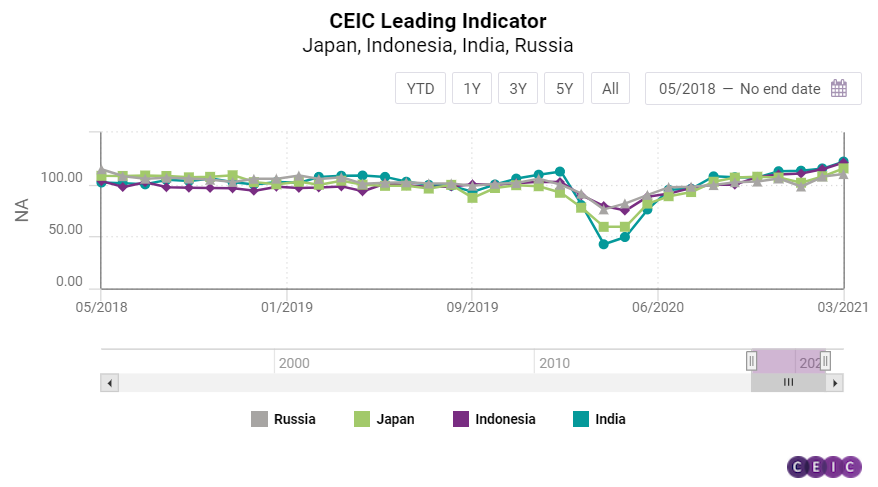
The CEIC Leading Indicator for India surged to 122 in March 2021 from 115.4 in February. The key driver of the increase in the indicator was a historic rise in electricity generation, by 23.5% y/y in March 2021, primarily on the back of a low base effect. India underwent a stringent lockdown between March 25, 2020, and May 3, 2020, which is likely to cause a low base effect for many other indicators. Steel production also benefitted from the low base, with a stellar increase of 25.7% y/y in the finished steel segment in March 2021 and a 19.3% y/y increase in the crude steel segment. Owing to the same phenomenon, passenger vehicle sales posted a whopping 78.7% y/y increase. Monetary indicators such as money supply and the amount outstanding in 91-day treasury bills both slowed down, to 15.5%and 9.4% y/y, respectively. The 91-day treasury bill yield increased once again to 3.3% in March 2021, signalling volatility in markets, thanks to an increase in new COVID-19 cases in the country. The Bombay Stock Exchange Sensex index averaged at 50,100 before closing at 49,509 at the end of March, showcasing the economic uncertainty accompanying the mounting cases of infections. The wholesale food prices also increased sharply in March 2021, by 5.3% y/y.
According to the CEIC Leading Indicator, the business cycle in Indonesia is approaching a peak and is performing at the strongest level since June 1999. The non-smoothed indicator rose by 6.3 points m/m to reach 121.1 in March, high above the threshold level of 100. A total of 84,910 motor vehicles were sold in the country in March, a figure unseen since before the pandemic and a sharp increase on both monthly and annual basis, by 72.6% and 10.5%, respectively. Non-oil and gas exports rose by 30.1% y/y. Indonesia continued to benefit from record-high palm oil prices which hit USD 1,145.3 per tonne. Cement consumption returned to growth in March, increasing by 10.6% y/y and signalling a recovery in the construction sector.
The CEIC Leading Indicator for Japan continued its strong rebound in March 2021, managing to gain 7.6 points on a monthly basis to reach 115.5. Domestic machine tool orders returned to growth for the first time since November 2018, increasing by an impressive 18.7% y/y and raising hope that better days for the Japanese industry lie ahead. According to the Economy Watchers survey, the current economic conditions in manufacturing have been improving since January 2021 and the March value reached 50.1 from 46.3 in the previous month. Motor vehicle sales accelerated again, growing by 5.4% y/y from 0.5% y/y in February 2021. Consumer confidence returned to pre-pandemic levels with Japanese households assessing their overall livelihood at the best state since December 2019.
The CEIC Leading Indicator for Russia reached 110 in March 2021 from 107.6 in the previous month, a performance far more subdued compared to the leading indicators of the majority of the observed economies. Similarly to the past five months, the economy benefitted from rising oil prices which reached USD 64.6 per barrel on average in March, the highest since January 2020. The development in the oil sector outweighed the concerns about new US sanctions against Russia in the stock markets as the Moscow stock exchange index RTS gained 4.6% in March compared to February. On the other hand, domestic automobile sales declined on an annual basis, shrinking by 5.7%, with growth remaining volatile since Q3 2020. Manufacturing production tendency also decelerated but remained positive at 3.6%.
Keep informed each month on the predicted turning points of the economic cycle for key markets with our free, proprietary CEIC Leading Indicator. Learn more and register here