-png.png)
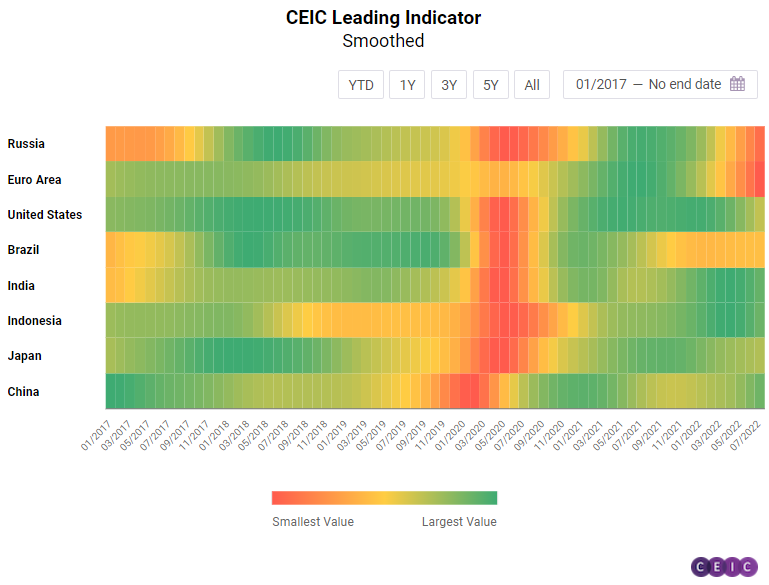
The CEIC Leading Indicator is a proprietary dataset designed by CEIC Insights to precede the development of major macroeconomic indicators and predict the turning points of the economic cycle for key markets. It is a composite leading indicator that is calculated by aggregating and weighting selected leading indicators covering various important sectors of the economy, such as financial markets, the monetary sector, labour market, trade, and industry. It is developed through a proprietary CEIC methodology and employs data from the CEIC database. The CEIC Leading Indicator currently covers eight regions – Brazil, China, India, Indonesia, Russia, the Euro Area, Japan, and the United States.
According to July 2022 data for the CEIC Leading Indicator, the business cycle outlook worsened for seven of the eight surveyed economies as a result of increasing commodity prices, especially in the energy sector, the continuing war in Ukraine and fears of prolonged stagflation of the global economy. The CEIC Leading Indicator for the US fell again in July as the housing market shows signs of a serious downturn. The eurozone and Russia, which are the most affected by the war in Ukraine, are struggling with sanctions hurting both economies, although high energy prices continue to support the Russian economy. China continues to recover from the COVID-19 lockdowns in April and May but the real estate crisis is threatening to seriously harm the economy in the second half of 2022. The indicators for India and Indonesia suffered massive drops as inflation is starting to affect their economies as well.
The CEIC Leading Indicator for China declined from 108.5 in June to 107.0 in July, still staying above the 100 threshold. The reading suggested that the Chinese economy is performing above its long-term trend. The automobile sector continued to recover, growing by 31.78% y/y in July, following the 28.62% y/y increase in June. China’s official manufacturing PMI, however, fell once again into negative territory, after rebounding slightly in June.
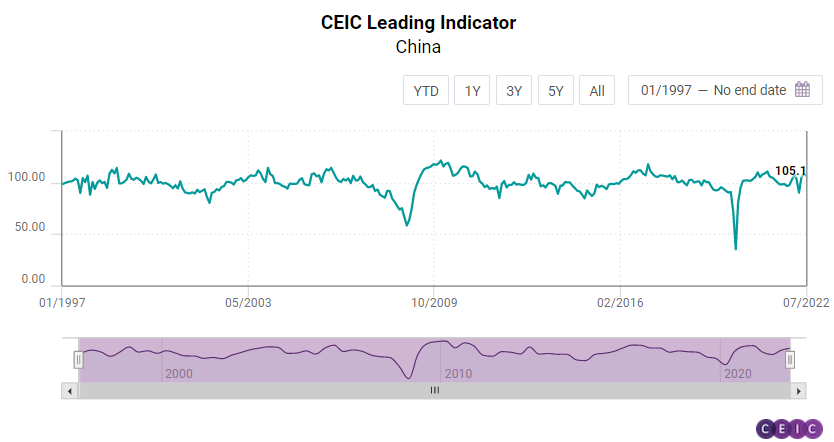
The index dropped to 49 from 50.2 in the previous month as four out of the five components fell below the threshold level of 50. In the first seven months, floor space sold of commodity buildings shrank by as much as 23.09% y/y. Money supply grew by 11.99% y/y in July. The smoothed CEIC Leading Indicator improved from 105.2 in June to 106.8 in July, suggesting improved growth prospects for the Chinese economy in the second half of the year.
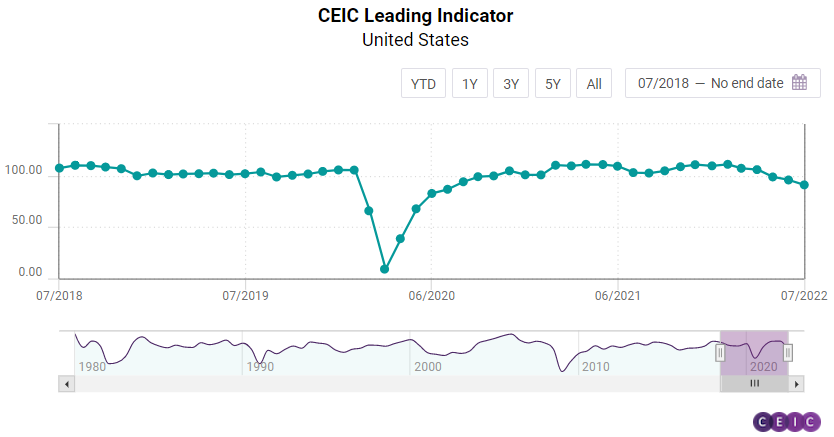
The CEIC Indicator for the US fell to its lowest level in two years, according to July data. The non-smoothed indicator decreased by 4.8 points m/m to 91.1, marking the third consecutive month of performance below 100 which separates expansion from contraction. The smoothed CEIC Leading Indicator fell 3.7 points m/m to 93.1, signalling that the US business cycle has fallen into a downturn phase. This performance was in line with the real GDP growth of the US in the last two quarters which turned negative and signalled technical recession. July marked another month of declining vehicle sales in the US, as they dropped by 11.3% y/y, the twelfth consecutive double-digit decline. The housing market index plummeted to 55, the sharpest drop since April 2020 as interest rate hikes are pushing mortgage rates up and home prices increase rapidly. The Conference Board consumer confidence index fell again in July, triggered by a deterioration in the present situation index, which fell to 141.3 from 147.2, while the expectation index declined only slightly, to 65.3 from 65.8. The deterioration in consumer confidence can be explained by the rising food and energy inflation. The ISM PMI eased slightly in July and has been mostly decelerating since September 2021 due to continuous supply chain constraints. The number of jobless claims in July continued to increase steadily, although the US labour market remains tight, with job openings and the unemployment rate at pre-pandemic levels. The Standard & Poors 500 stock market index closed in July at 4,130.3, managing to recover the losses in June.
The CEIC Leading Indicator for the Euro Area surpassed its previous record low, reached in 2020, and dropped to 59.29 in June from 69.4 in May. The smoothed indicator also maintained its downward trend, started in July 2021, and fell to a record 59.58 in June, following 67.76 in the previous month. Both consumer and business confidence, measured by the indices by the European Commission's Directorate General for Economic Affairs, deteriorated in June. Inflation kept accelerating to 8.6% y/y, pushed up mainly by the energy prices. Against the backdrop of ever-increasing prices and geopolitical uncertainty due to the war in Ukraine, the equity markets remained subdued, with the Euro Stoxx 600 index closing June with the sharpest monthly decline since 2020. Over the first quarter, Stoxx 600 was down 12%, while the year-to-date decline was 20%.
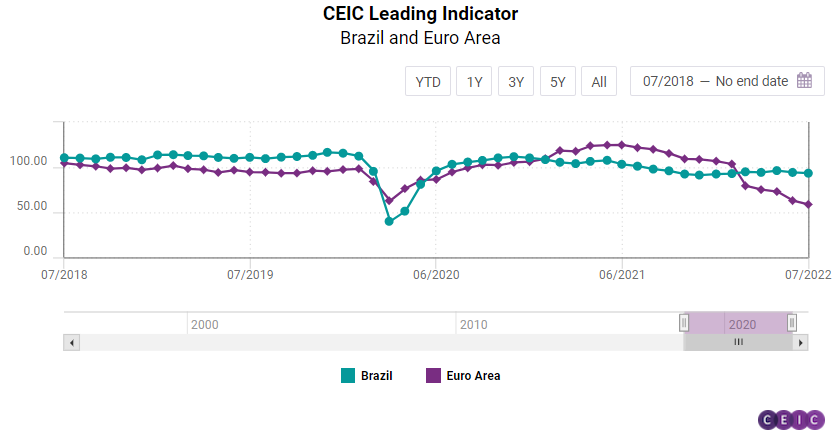
Brazil’s CEIC Leading Indicator fell by 0.84 points to 93.45 in July, remaining below the 100 threshold for the eleventh month in a row and reflecting the potential negative impact of some recent government stimulus measures on Brazil’s public budget next year. The manufacturing confidence indicator declined to -0.5% in the seventh month of the year, from 1.2% in June, reflecting higher production costs and supply chain bottlenecks related to the lockdowns in China and the war in Ukraine. The consumer inflation expectation indicator rose further to 11.4 – a seven-year high. However, fuel prices may push inflation down in the next months, as governments reduced taxes on fuels, and international crude oil prices fell to a monthly average of USD 108.55 per barrel in July 2022, from USD 117.72 per barrel in June. Brazil's equity market index Ibovespa rose by 4.69% m/m in July, standing at 103,164 at the end of the month, reflecting high profits announced by the national oil company Petrobras, and new expectations on the US monetary policy, after the North American country entered a technical recession. Moreover, Brazilian construction companies were more optimistic about the future in July, as the expectation to purchase inputs index rose to 56.1 in July from 55.2 in June. The smoothed CEIC Leading Indicator improved by 0.08 points to 94.41 in July, which is still below the 100 threshold, meaning that Brazil may grow below the long-term trend in the next quarters.
Japan’s CEIC Leading Indicator dropped to 100.2 in July from 102.4 in June. This marked the third consecutive month of deceleration for the non-smoothed indicator, although it still remains above the threshold of 100. The smoothed indicator dropped to 100.6 from 101.4 and has been decelerating since October 2021, signalling that Japan’s business cycle is currently in a cooldown phase with the peak having likely passed in the second half of 2021. Motor vehicle sales declined for the twelfth consecutive month, although the 7.5% y/y registered in July is the lowest decrease over this period. Consumer confidence for overall livelihood fell to its lowest level since May 2020 amid price hikes for essential commodities such as food, fuel, and electricity. Corporate manufacturing sentiment remained almost unchanged in July. OECD’s CPI based real effective exchange rate (REER) dropped again in July, falling to its lowest level since 1973. Japan’s TOPIX small index closed July at 2,288.2, the strongest since December and essentially regaining lost ground since the start of 2022.
India’s CEIC Leading Indicator decelerated sharply in July, by 9.1 points, to 101.6. The indicator remained in the expansionary phase above the 100 threshold, albeit inching closer to the contraction phase. The value of the CEIC Leading Indicator was primarily dragged down by the wholesale food inflation, followed by electricity generation, steel production, vehicle production, and money supply. The growth in the wholesale price index for food slowed to 9.4% in July, from 12.4% in the previous month. Electricity generation grew by 2.5% y/y in July, slowing sharply from 16.9% y/y, also dropping in actual terms to KWh 118.9bn. Crude steel production witnessed a slowdown in its growth, to 2.2% y/y from 6.3% y/y. Production of automobiles grew for a fourth consecutive month in a row to 2.2mn units, reaching the highest level since March 2021, and growing by 4.7% y/y in July as the low base dissipated. Money supply grew by 9.2% y/y in July, picking up from 8.7% y/y in June, but the contribution to the CEIC leading indicator was negative. On the bright side, the Bombay Stock Exchange S&P Sensex mitigated the deceleration in the CEIC leading indicator the most, as the equity market climbed upwards throughout the month of July 2022. The index recorded a growth of 8.6% m/m, marking the highest value since March 2022, driven by a return of foreign investors on the back of good profits posted by several companies, as well as the second consecutive decline in the US GDP. The 91-day treasury bills yield increased to 5.6% p.a., due to monetary tightening, elevated inflation, and growing demand for government bonds in this new era of uncertainty. The increase in the yield was accompanied by a decline in the total amount outstanding, by 5.7% y/y in July, although the decline narrowed from 10.4% y/y over the previous month. The sharp deceleration in the actual CEIC Leading Indicator pulled down the smoothed CEIC Leading Indicator, which dropped to 107.5 in July, from 109.4 in June. Due to its dynamic nature, the smoothed indicator reflects a third consecutive decline since April 2022, capturing the impact of worsening supply shocks, as well as heightened inflation. Resultantly, India’s economic growth is expected to be lower than what it could have been, although a resilient consumer demand and an uptick in industrial activity bodes well for the economy.
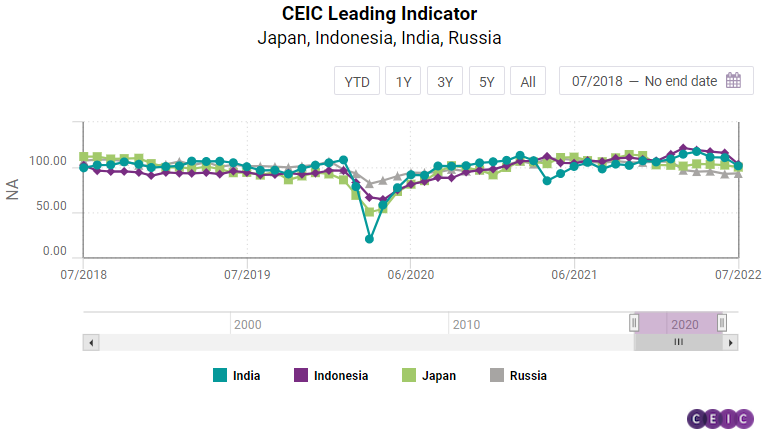
The CEIC Leading Indicator for Indonesia registered its sharpest drop since the first wave of the COVID-19 pandemic. The non-smoothed indicator dropped by 12.5 points in July 2022 to 103.4. The July performance also marked the fourth consecutive month of deceleration in the non-smoothed indicator, although it registered high values in the first half of the year and was among the best performing economies surveyed by the CEIC Leading Indicator. July’s decline was influenced by a sudden drop in median crude palm oil prices, which fell to USD 1,285.8 per tonne from USD 1,653.5 in June, on the back of a desire to ease the high inventory of the commodity. The lower price of palm oil affected Indonesia’s non-oil and gas exports whose growth decelerated to 31.6% y/y in July. Motor vehicle sales returned to double-digit growth in July, increasing by 29.4% y/y, with sales being boosted by a luxury tax discount of 66% for vehicles costing up to IDR 200mn. The rupiah depreciated to its lowest level since April 2020, trading at IDR 14,958 per USD, as the Bank of Indonesia is still keeping interest rates unchanged despite inflationary pressures. The Jakarta composite stock exchange index closed July at 6,951.1, barely changed compared to June’s closing value. The smoothed CEIC Leading Indicator fell to 111 in July, but remains firmly above the threshold value of 100, separating expansion from contraction. However, if the deceleration trend continues, it could be assumed that the business cycle peak passed in Q2 2022.
The CEIC Leading Indicator for Russia was the only one which registered a monthly increase in July, rising by 0.5 points to 93.1. High oil prices in July continued to support the Russian economy amid heavy Western sanctions due to the ongoing war in Ukraine, although the average crude oil price was slightly lower compared to June, at USD 108.9 per barrel. Passenger car sales, however, continued to deteriorate strongly, falling by 75.6% y/y, as a consequence of both low demand and a shortage of supply parts for producers due to the sanctions. Manufacturing production tendency improved slightly in July but is still far from the pre-war readings. The RTS stock exchange index closed July at 1,129.2, down 16% m/m and effectively erased the gains in May and June.
Keep informed each month on the predicted turning points of the economic cycle for key markets with our free, proprietary CEIC Leading Indicator. Learn more and register here