
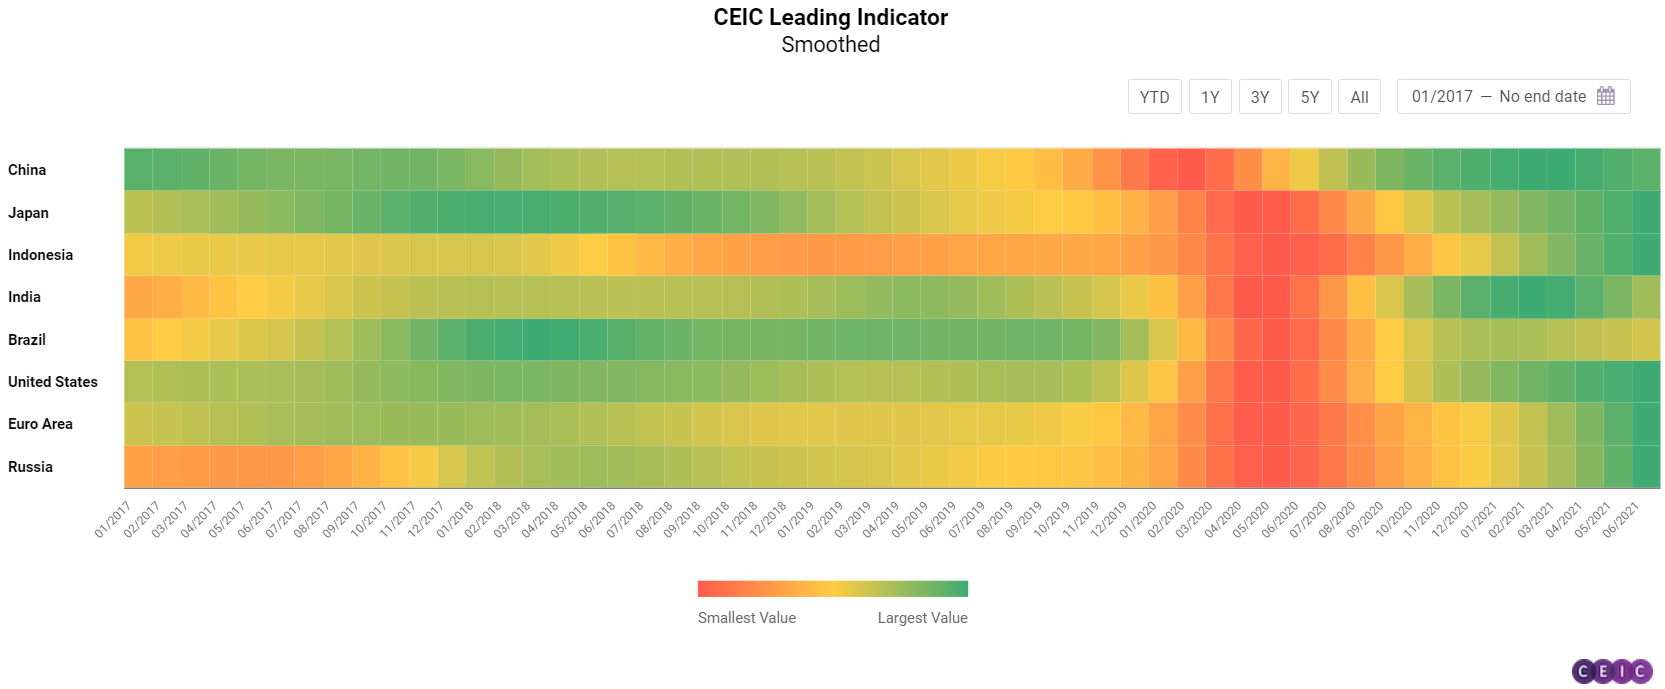
The CEIC Leading Indicator is a proprietary dataset designed by CEIC Insights to precede the development of major macroeconomic indicators and predict the turning points of the economic cycle for key markets. It is a composite leading indicator that is calculated by aggregating and weighting selected leading indicators covering various important sectors of the economy, such as financial markets, the monetary sector, labour market, trade, and industry. It is developed through a proprietary CEIC methodology and employs data from the CEIC database. The CEIC Leading Indicator currently covers eight regions – Brazil, China, India, Indonesia, Russia, the Euro Area, Japan, and the United States.
According to June 2021 data for the CEIC Leading Indicator, the majority of the surveyed economies are still performing above the long-term average of 100, but in some cases, there are signs that the post-pandemic peak has passed and the business cycle is in a cooldown phase. China’s moderation in Q2 was confirmed by recent GDP figures, Japan and India are back on track after a difficult May, Indonesia, the US, and the Euro Area declined on a monthly basis for the first time after strong runs, while Brazil is recovering steadily from the poor start of the year.
China: Economy Falling Back to Normal
The CEIC Leading Indicator for China declined for the third month in a row in June, dropping to 106.2 from 108.9 in May. This performance suggests that China is likely past the post-COVID peak of its business cycle and the economy is slowly falling back to values close to its long-term average.
The manufacturing sector in China continued to face downward pressures linked to rising producer prices and global supply change disruptions. China’s manufacturing PMI dropped to 50.9 in June, the lowest value since February and close to the threshold value of 50. After ending 13 months of positive y/y growth in May, automobile production declined even more aggressively in June, dropping by 16.9% on an annual basis. The automobile sector in the country has been harmed by the ongoing global shortage of semiconductor chips. Growth of money supply accelerated again, increasing by 8.6% y/y in June from 8.4% in the previous month. The growth rate of financial institution deposits also followed a similar pattern, accelerating to 9.2% y/y in June. The recovery in the real estate sector continued to cool down, as floor space sold of commodity buildings in the period January-June 2021 increased by 27.7% y/y compared to 36.3% y/y growth in the period January-May 2021.
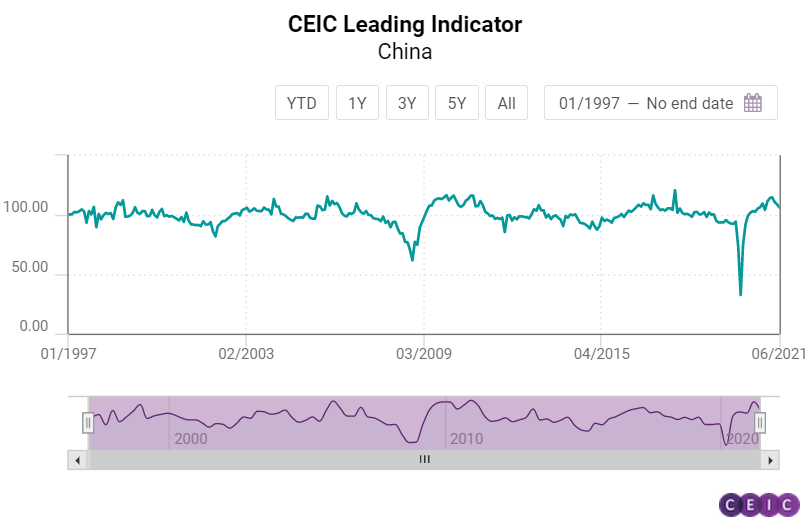
The smoothed CEIC Leading Indicator dropped for the fourth month in a row in June, to 108.5, suggesting that the moderation phase in the business cycle of China since February is persistent. Chinese GDP growth figures have been in line with the development of the CEIC Leading Indicator with a record peak in Q1 2021 followed by a moderation in Q2.
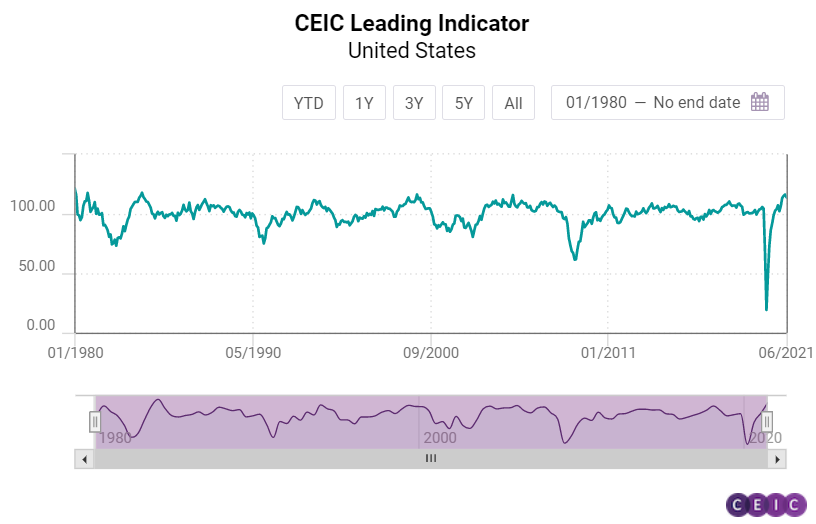
US, Euro Area, and Brazil: A Step Back for the US and the Eurozone
June 2021 data for the CEIC Leading Indicator showed initial signs of a cooldown for the US and eurozone economies for the first time since January. Meanwhile, the leading indicator for Brazil grew for the second month in a row, although it still lingers above the threshold value of 100.
After peaking at 116.3 in May 2021, its highest value since December 1999, the CEIC Leading Indicator for the US decreased to 113.95 in June. This outcome was influenced by a monthly drop of the purchasing managers’ index, which fell to 60.6 from 61.2 in May, although the figures remain well above the threshold value of 50. The low base effect from the poor vehicle sales at the peak of the pandemic last year has begun to fade away, as growth decelerated to 18.4% y/y in June compared to 109.7% y/y in April and 41.9% y/y in May. The housing market index in June fell to 81, its lowest reading since August 2020, signalling a cooldown in the real estate sector as well. Consumer confidence, on the other hand, improved for the fifth month in a row and is approaching pre-pandemic levels. Capacity utilisation is slowly improving from the sudden drop in February 2021 and stood at 75.4%, also close to 76.3% in February 2020. The S&P 500 index closed June at a historic high of 4,297.5, gaining 2.2% compared to the previous month.
The CEIC Leading Indicator for the Euro Area ended four consecutive months of spectacular growth in June, dropping by 1.1 points m/m to 121.1. Nevertheless, it continues to be the best performing indicator among the observed, second only to Indonesia. The slight drop in performance was caused by a decrease in building activity confidence, which declined for the second month in a row. Industrial confidence in basic metals manufacturing also decelerated for the first time since April 2020, increasing by 21.1 pp compared to 22.5 pp in the previous month. On the other hand, the employment in the manufacturing index rose to 58.3, the highest reading on record. Consumer sentiment also improved, with confidence over the financial situation in the next 12 months increasing by 2.1 pp, the highest since November 2019. The Dow Jones Euro Stoxx index recorded a small m/m gain of 0.8% and closed June at a record high of 451.96.
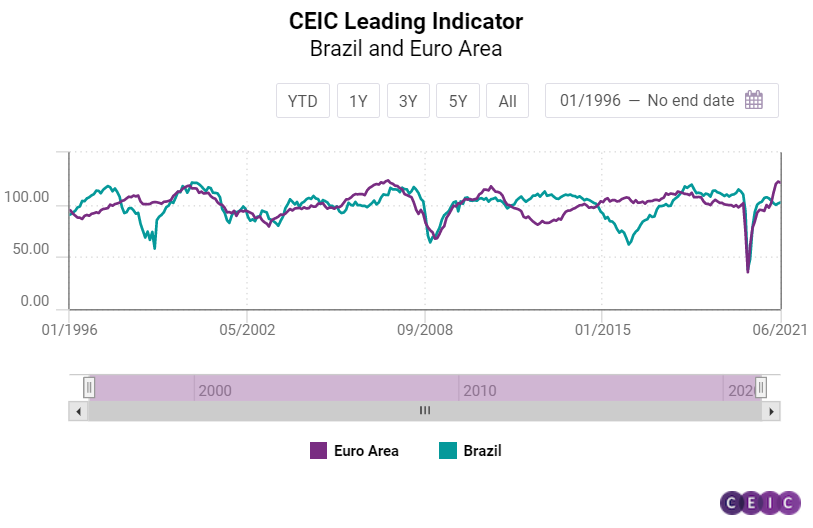
The Brazilian economy may grow above the long-term trend between Q4 2021 and Q1 2022, according to the CEIC Leading Indicator, which anticipates turning points of the business cycle. The indicator rose for the second straight month, to 102.3 in June, above the threshold of 100. Many face-to-face activities in the services sector may rebound in the second half of 2021, as the number of vaccinated people in the country has been steadily rising. As of July 4, 36% of the Brazilian population have received their first jab and 12.7% were fully vaccinated. The manufacturing confidence indicator rose to 7.6% in the month from 4.2% in May, reflecting the recovery in the world’s main economies, which may have a positive impact on Brazilian exports. The construction industry remains robust, as the expectation to purchase inputs index increased to 56.6 in June from 54.9 in May 2021. The consumer inflation expectation indicator recorded its fifth increase in a row to 6.1 in June, supported by higher prices of electricity and fuels. The international crude oil prices rose further to a monthly average of USD 71.9 per barrel in June from USD 66.9 per barrel in May. In the stock markets, the equity market index inched up to 126,801 in the end of June, from 126,216 in the end of May, amid uncertainties regarding the country’s tax reform and the economic impact of the new strains of the COVID-19.
Japan, India, Indonesia and Russia: Japan and India Back on Track
While the CEIC Leading Indicator for Indonesia remained the strongest performer among all surveyed economies in June, it dropped for the first time since October 2020 on a monthly basis. India and Japan managed to gain some of their losses in May and returned to growth. The CEIC Leading Indicator for Russia has been volatile since the beginning of 2021 and registered a slight drop in June.
The CEIC Leading Indicator bounced back to 101.9 in June 2021 from 95.7 in May, effectively bringing the Indian economy back into an expansion phase. Despite moderation in the growth rate of electricity generation to 6.3% y/y in June, it was one of the key drivers of the increase in the leading indicator. Passenger vehicle production growth moderated as well, to 174.9% y/y, still experiencing favourable base effects, and was another important contributor to the leading indicator’s rebound. The y/y growth in crude steel slowed down from 46.9% in May to 19.9% in June. Finished steel production followed suit, as growth decelerated from 58.4% in May to 25.8% in June. Under monetary and financial segments, the money supply increased by 14.9% in June, and the Bombay Stock Exchange Sensex closed at 52,482.7 points, the highest value on record. The 91-day Treasury bills yield increased marginally, by 4 pp, to 3.44% pa in June. The wholesale price index pertaining to food slowed down from 8.1% y/y in May, to 6.7% y/y in June. The smoothed CEIC Leading Indicator declined further to 103.9 in June, from 107.4 in May, echoing the extent of damage caused by the second wave of infections. However, the rebound in the actual leading indicator is suggestive of the decline bottoming out, although much depends on how India’s vaccination drive pans out. Most parts of India are now functioning normally, without any major lockdowns but the impending threat of a third wave makes economic recovery more uncertain.
The CEIC Leading Indicator for Indonesia declined for the first time since October 2020, dropping to 121.3 from the historic peak of 123.4 in the previous month. Booming palm oil prices finally cooled down in June, falling by 15.1% m/m to USD 1,085.4 per tonne. This outcome was driven by the high production of the commodity due to favourable weather conditions. Non-oil and gas exports also decelerated but still grew at a steady pace of 51.4% y/y. A similar development can be observed in the vehicle market with sales of motor vehicles up by 476.1%, benefitting from the low base effects from the pandemic lockdown in 2020, but also decelerating compared to the figures in April and May. The rupiah lost some ground against the USD in June, increasing to IDR 14,496 per USD from IDR 14,310 in May. The Jakarta composite index closed at 5,985.5 in June, gaining 0.6% compared to June, but has yet to recover from the drop in February.
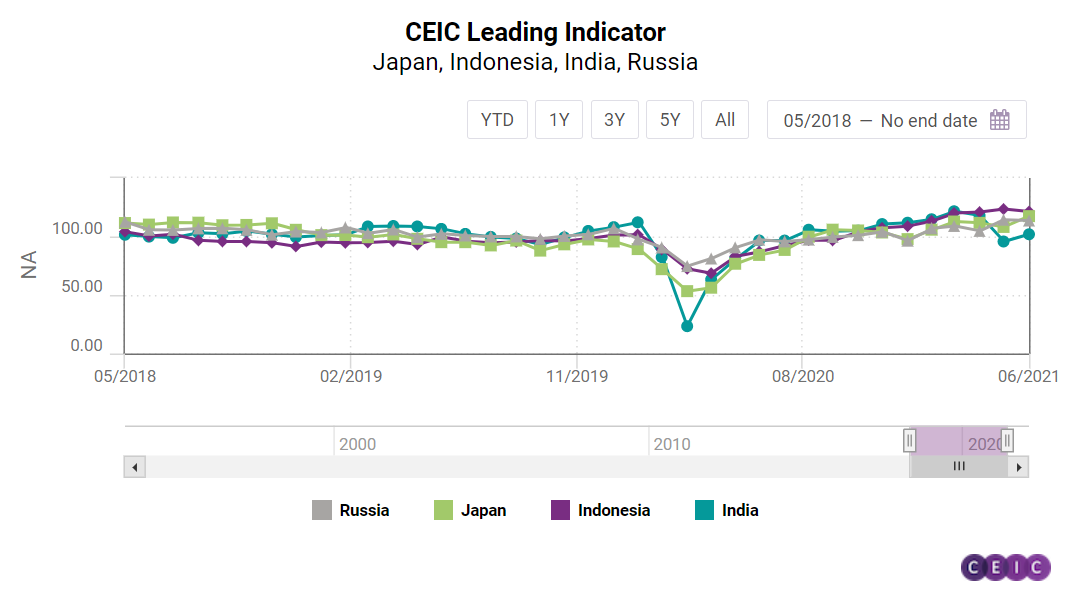
The CEIC Leading Indicator for Japan recovered spectacularly in June, jumping by 9.2 points m/m to 117.4, the biggest improvement among the surveyed economies. Consumer confidence increased to 38.6, the highest since February 2019, after some COVID-19 restrictions were lifted in certain areas. Corporate sentiment in manufacturing also improved dramatically after two consecutive months of decline. Domestic machine tool orders continued to enjoy rapid growth due to the low base effect from Q2 2020 and increased by 91.5% y/y, the highest since January 2011. Motor vehicle sales growth, however, decelerated to 5.3% y/y from 46.3% y/y in May.
While the non-smoothed CEIC Leading Indicator for Russia has been volatile since the beginning of 2021 and in June it dropped to 113.7 from 114.3 in May, its smoothed counterpart rose by 2.3 points to 113.7, suggesting that the business cycle in the country is still in an expansion phase. Low base effects from Q2 2020 have started to fade away in the automobile market as growth in new car sales decelerated to 28.7% y/y from 290.4% y/y in April and 133.8% y/y in May. Crude oil prices continued to rise in June and averaged USD 71.9 per barrel compared to USD 66.9 per barrel in May. However, prices are expected to decline in the coming months due to a July agreement between OPEC members to boost oil supply. Manufacturing production tendency in Russia continued its upward trend, rising by 15%. The RTS index has also performed well in June, closing the month at 1,653.8 on the back of a cooldown in geopolitical tensions.
Keep informed each month on the predicted turning points of the economic cycle for key markets with our free, proprietary CEIC Leading Indicator. Learn more and register here