
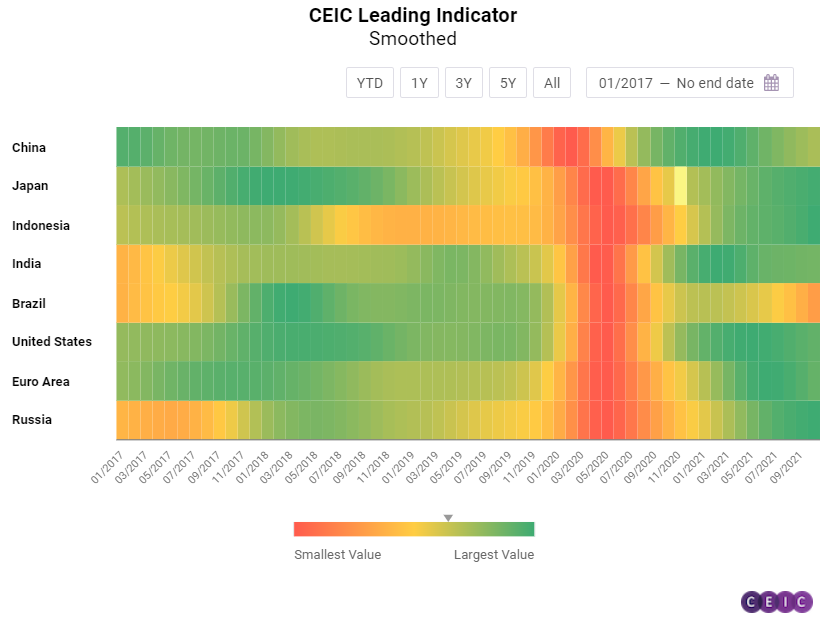
The CEIC Leading Indicator is a proprietary dataset designed by CEIC Insights to precede the development of major macroeconomic indicators and predict the turning points of the economic cycle for key markets. It is a composite leading indicator that is calculated by aggregating and weighting selected leading indicators covering various important sectors of the economy, such as financial markets, the monetary sector, labour market, trade, and industry. It is developed through a proprietary CEIC methodology and employs data from the CEIC database. The CEIC Leading Indicator currently covers eight regions – Brazil, China, India, Indonesia, Russia, the Euro Area, Japan, and the United States.
October 2021 data for the CEIC Leading Indicator was moderately optimistic and for the first time in seven months the indicators for the majority of the surveyed regions registered monthly increases. The exceptions were the Euro Area and China, which still performed above their long-term trends, and Brazil which dropped below 90 for the first time since June 2020.
China: Economic Expansion Slows Down
The CEIC Leading Indicator for China dropped slightly to 102.11 in October from 102.37 in the previous month. The Chinese economy is still performing above its long-term average but the economic expansion may slow down in the rest of the year and in Q1 2022. China’s official manufacturing PMI stayed below the 50-point threshold for the second month in a row at 49.2, as manufacturers struggled with the surging raw material costs and ongoing power shortages. As the high base effect from last year faded, automobile production declined by 8.7% y/y in October.
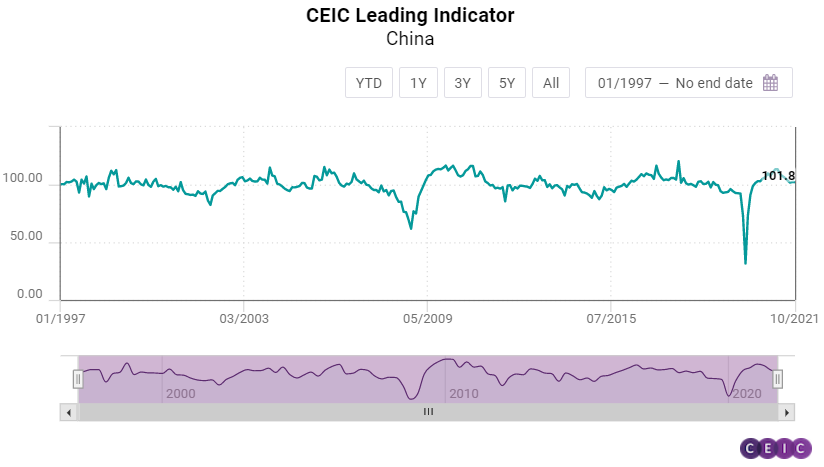
However, automobile production has been on an upward trend m/m since August. In October a total of 2.3mn cars were produced, up from 2.1mn in September. Growth of money supply M2 accelerated, increasing to 8.67% y/y in October from 8.26% in the previous month. The expansion of financial institution deposits also accelerated to 9.14% y/y from 8.58% y/y in September. Affected by tighter regulations, China’s real estate sector continued to cool down, as floor space sold of commodity buildings in the period January-October 2021 increased by 7.31% y/y compared to 11.33% y/y in the period January-September 2021. The smoothed CEIC Leading Indicator has been on a downward trend since February 2021. In October, it declined further to 101.02. Although retail sales data slightly improved in October, weak domestic consumption continued to be a concern for China's economic outlook in Q4 2021 as well as Q1 2022.
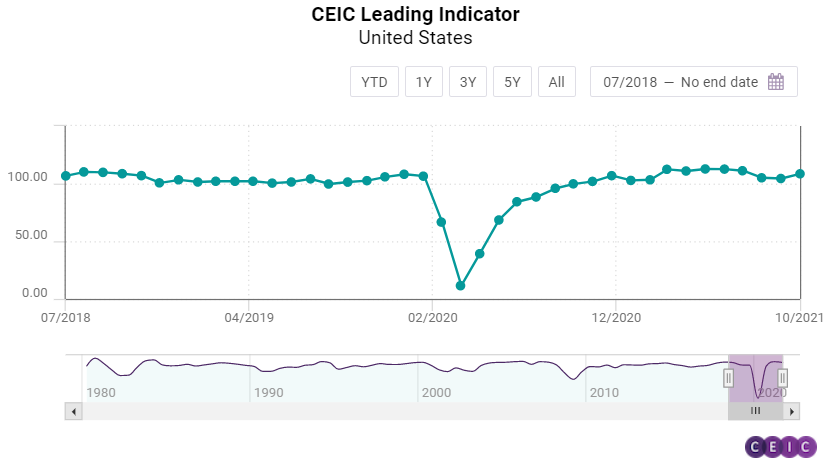
US, Euro Area and Brazil: US Picks up Pace, Brazil Further Down
After three months of moderation, the CEIC Leading Indicator for the US picked up the pace in October, increasing by 4.1 points m/m to 108.6. The ISM purchasing managers’ index decelerated slightly in October to 60.8, but is still performing strongly and well above the threshold of 50. Seasonally-adjusted capacity utilisation managed to compensate for the sharp drop in September and jumped to 76.4%, which finally puts it above the pre-pandemic rate. The housing market index increased to 80 in October from 76 in September, revealing that the real estate sector is back on track, with preliminary data for November suggesting further acceleration. On the other hand, the number of private housing units started to drop for the fourth month in a row due to increasing prices of raw materials. Motor vehicle sales decreased in the double digits for the third month in a row, declining by 22.5% y/y in October. The S&P 500 index closed October at 4,605.4, managing to regain the losses in September.
The CEIC Leading Indicator for the Euro Area decreased in October to 108.71 from 113.12 in the previous month. This is the lowest level since March 2021 and the fifth decline in a row. Among the components driving the index, the consumer sentiment towards the financial situation in the next year deteriorated. The indicator, published by the European Commission, declined by 0.1 pp from 1.5 pp. The ever-accelerating inflation, which was at a 13-year high of 4.1% y/y in October, keeps causing concerns among households and businesses alike. The industrial confidence in the basic metals segment of manufacturing deteriorated too, falling to 15.9 pp in October from 17.6 pp in the previous month. On the other hand, the equity market provided some support to the CEIC Leading Indicator, closing the month higher and essentially reversing the losses from September. Employment measured by the IHS Markit PMI sub-index also increased to 56.1 from 55.4.
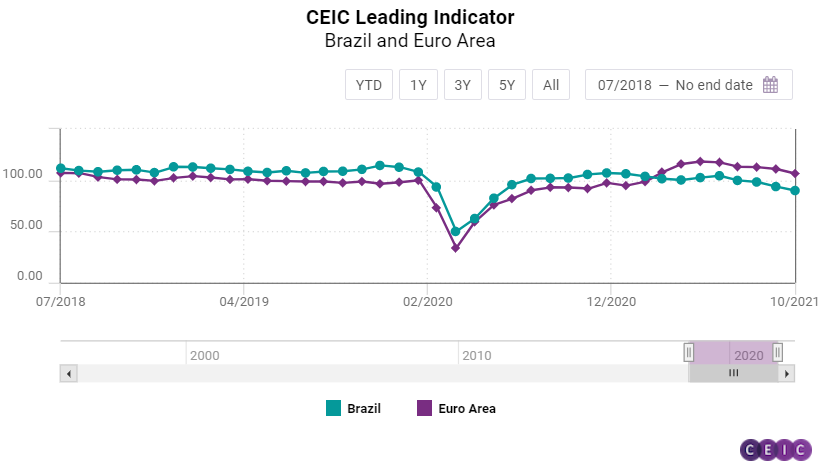
The CEIC Leading Indicator for Brazil fell below 90 in October, for the first time since June 2020. The non-smoothed indicator stood at 89.9 compared to 93.8 in September. This also marked the fourth consecutive month of decline for the indicator, suggesting that the economy is currently in a downturn phase. Continuously rising consumer inflation, the ongoing energy crisis, and the weak Brazilian real have hampered the recovery prospects of Latin America’s largest economy. Rising inflation expectations have been at the core of the underwhelming performance of the CEIC Leading Indicator in October. FGV’s consumer inflation expectation indicator jumped to 8.9 from 7.7 in September, suggesting that the already double-digit inflation in the country might rise even further, despite the interest rate hike undertaken by the Central Bank in the last week of October. Manufacturing confidence declined by 1.2 pp m/m in October, to 5.4%. The booming construction sector might also slow down in the coming months, as the expectation to purchase inputs index declined slightly to 55 in October from 55.1 in September 2021. The performance of the equity market index Ibovespa was also in line with the struggling economy as it closed October at its weakest in a year, at 103,500.7. International crude oil prices averaged USD 82.1 per barrel in October, rising above USD 80 per barrel for the first time in seven years. In the long run, Brazil’s economic growth may also moderate, as the smoothed CEIC Leading Indicator fell by 3.7 points to 91.8, below the neutral value of 100. The smoothed indicator has been declining since January 2021, suggesting that the immediate peak of Brazil’s post-COVID-19 recovery has passed at the beginning of the year.
Japan, India, Indonesia and Russia: A Step Forward
The CEIC Leading Indicator for Japan increased confidently in October to 105.54 from 100.34 in the previous month, putting an end to the three-month downward trend. The smoothed indicator, on the other hand, kept declining, inching down to 104.39 in October from 105.48 in September, posting its fifth consecutive fall. There is an improvement observed in the manufacturing sector, with the respective economic sentiment indicator increasing to 52.7 in October from 47.3 in the previous month. Consumer confidence barely changed, while motor vehicle sales maintained their double-digit annual decline rate in October. The local currency depreciated further, reflected in the declining real effective exchange rate index, which supported some big companies' financial results. The equity market index Topix small closed October down to 2,413 from 2,456 points in the previous month, after two consecutive increases.
After a temporary decline in September, the CEIC Leading Indicator for India increased once again in October by 4.7 points to 106.8. The turnaround in the CEIC leading indicator can be attributed to the rising electricity generation and wholesale food price index, as well as to the narrowing of the decline in passenger car production. On the other hand, steel production, treasury bills, and equity indices played the role of a detractor. Despite an increase in the actual CEIC leading indicator, the smoothed CEIC Leading Indicator did not turn around and recorded a fourth consecutive decline, to 105.9 in October. This suggests that the long-term downward risk to India’s growth lingers on, especially as the commodity prices remain elevated globally and supply chain disruptions are yet to ease.
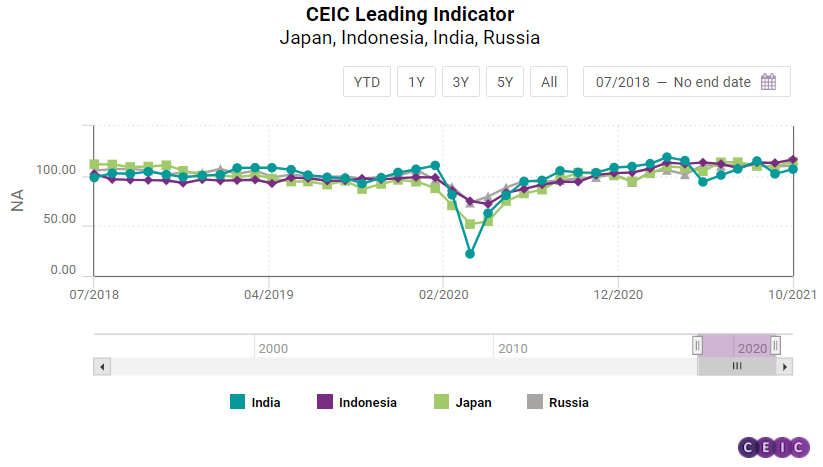
After a slight drop in September 2021, the CEIC Leading Indicator for Indonesia returned to growth in October, increasing by 3.4 points m/m to 116.5 and continues to be the best performing among the observed regions. Palm oil prices continued to rise and reached another historic peak, averaging USD 1,413.1 per tonne in October. This contributed to another strong month of non-oil and gas exports’ value growth, which amounted to 52.8% y/y, higher than the 48% y/y increase in September. Cement consumption accelerated moderately in October, growing by 4.6% y/y compared to 3.9% y/y in the previous month, displaying a robust performance after the low base effect faded in Q2 2021. Motor vehicle sales have been decelerating since May 2021, but continue to be much stronger than in most markets globally due to the extension of the tax discount for motor vehicles until the end of the year. The Jakarta composite stock exchange index closed in October at 6,591.4, gaining 4.8% m/m and closing at the highest level since February 2018. The smoothed CEIC Leading Indicator for Indonesia increased in October, reaching 114.9 and suggesting that the Indonesian economy is still performing above its long-term trend and that the peak of the business cycle has not been passed yet.
The CEIC Leading Indicator for Russia continued to hover between very tight margins for yet another month in October. The indicator increased to 110.5 from 109.3 in the previous month, remaining between 111.4 and 109.3 for six months straight. Sales of new cars on the domestic market picked up a notch in October, increasing to 126,204 units from 119,485 in September but on an annual basis, growth remains negative, at -18.1%, due to a global shortage of microchips. The OPEC spot crude oil price averaged USD 82.1 per barrel, the highest in seven years, which would boost Russian exports’ value. After five consecutive months of improvement, production tendency in manufacturing declined in October, dropping to 25.7% from the 14-year peak of 27.5% in the previous month. The RTS stock exchange index closed in October in a strong fashion, gaining 3.7% m/m and at its highest since July 2011.
Keep informed each month on the predicted turning points of the economic cycle for key markets with our free, proprietary CEIC Leading Indicator. Learn more and register here