-png.png)
The CEIC Leading Indicator is a proprietary dataset designed by CEIC Insights to precede the development of major macroeconomic indicators and predict the turning points of the economic cycle for key markets. It is a composite leading indicator which is calculated by aggregating and weighting selected leading indicators covering various important sectors of the economy, such as financial markets, the monetary sector, labour market, trade and industry. It is developed through a proprietary CEIC methodology and employs data from the CEIC database. The CEIC Leading Indicator currently covers eight regions – Brazil, China, India, Indonesia, Russia, the Euro Area, Japan and the United States.
The rapid post-lockdown expansion of the CEIC Leading Indicator for China came to an end in July 2020, as it declined very marginally by 0.1 points m/m. Since its trough in February 2020 when the indicator fell to 61.7, the lowest value since the 2008-2009 Great Recession, it showed a remarkable comeback, reaching a three-year peak of 110.8 in June. However, the indicator’s performance has been showing signs of moderation since May and it seems that as of July, the low base effects from the poor performance in January and February, when the COVID-19 outbreak hit China the hardest, have faded.
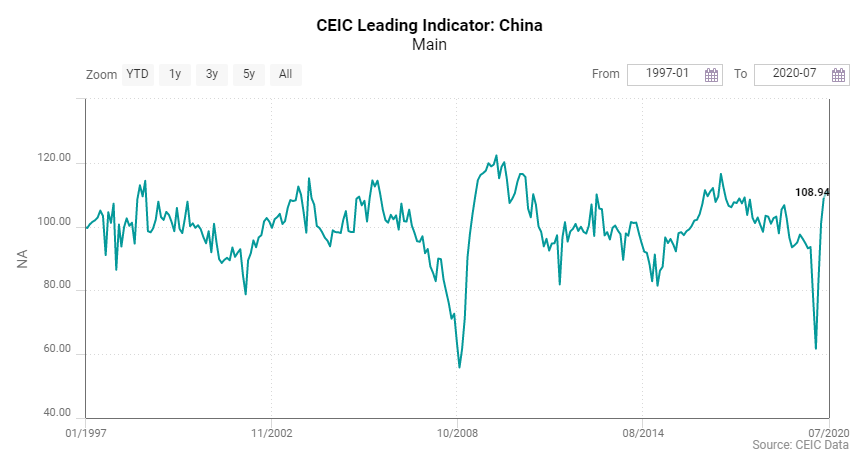
The automobile sector, which was severely hit by the pandemic not only in China but also globally, continues to recover, although July figures suggest a slight moderation in automobile production on a monthly basis, as output was down by 53,000 vehicles compared to June. Nevertheless, in y/y terms, the growth stood at 21.8%, the highest since September 2016. The increase in money supply M2 also decelerated in July, falling below 11% y/y for the first time since March. Growth of financial institution deposits also reached a plateau, ending its continuous acceleration since February, at 10.3% y/y compared to 10.6% in June. Manufacturing confidence continues to be solid according to the National Bureau of Statics’ manufacturing PMI, which remains stable above the neutral point of 50%, at 51.1% in July. The real estate sector is functioning at pre-pandemic levels and in July the floor space sold of commodity buildings increased by 9.5% y/y.
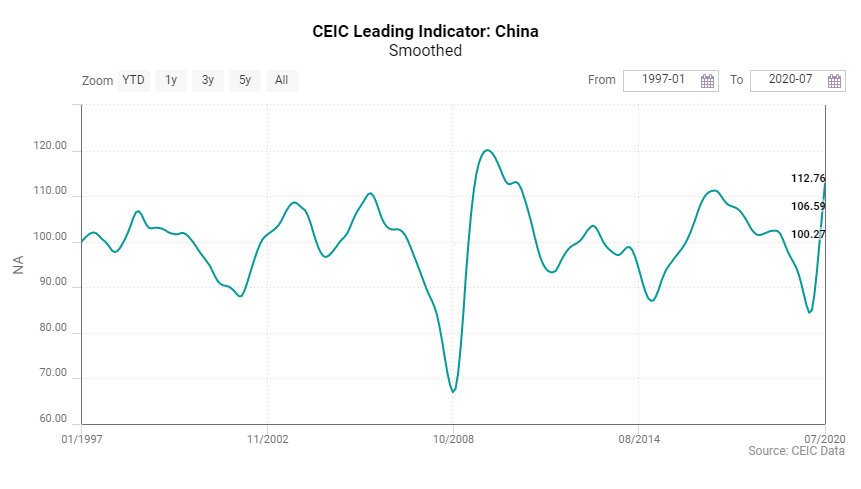
Unlike its non-smoothed counterpart, the smoothed CEIC Leading Indicator for China continued to increase, reaching 112.8, its highest level since April 2017. This performance suggests that China is still on the path to economic acceleration with expectations that real growth figures would be even stronger in the second half of the year compared to Q2 2020.
Keep informed each month on the predicted turning points of the economic cycle for key markets with our free, proprietary CEIC Leading Indicator. Learn more and register here