-png.png)
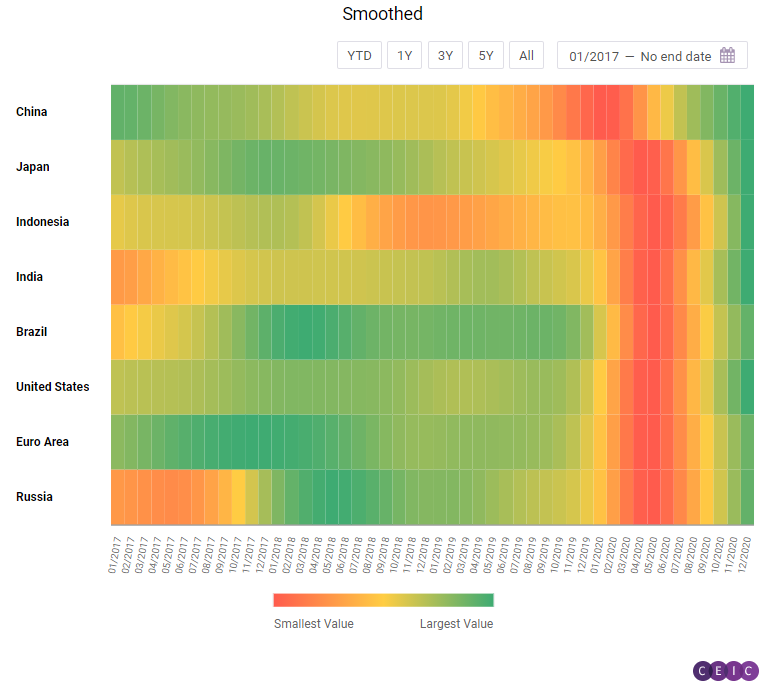
The CEIC Leading Indicator is a proprietary dataset designed by CEIC Insights to precede the development of major macroeconomic indicators and predict the turning points of the economic cycle for key markets. It is a composite indicator which is calculated by aggregating and weighting selected leading indicators covering various important sectors of the economy, such as financial markets, the monetary sector, labor market, trade and industry. It is developed through a proprietary CEIC methodology and employs data from the CEIC database. The CEIC Leading Indicator currently covers eight regions - Brazil, China, India, Indonesia, Russia, the Euro Area, Japan and the United States.
December 2020 ended an unprecedented year marked by the COVID-19 pandemic and too the economic fallout caused by the restrictive measures to contain the spread of the virus. Although the negative consequences are still to be experienced in 2021, the CEIC Leading Indicator shows that all the surveyed economies maintain their stable footing in the face of the uncertainties ahead. All eight indicators are staying above the 100-mark supporting optimistic sentiment. China and Japan saw a decrease in December, while the rest of the countries posted higher readings than in November. barely changed in October. The floor space sold of commodity buildings finally recorded a positive y/y growth rate - in the first ten months of 2020, it was marginally higher than in the same period of the previous year.
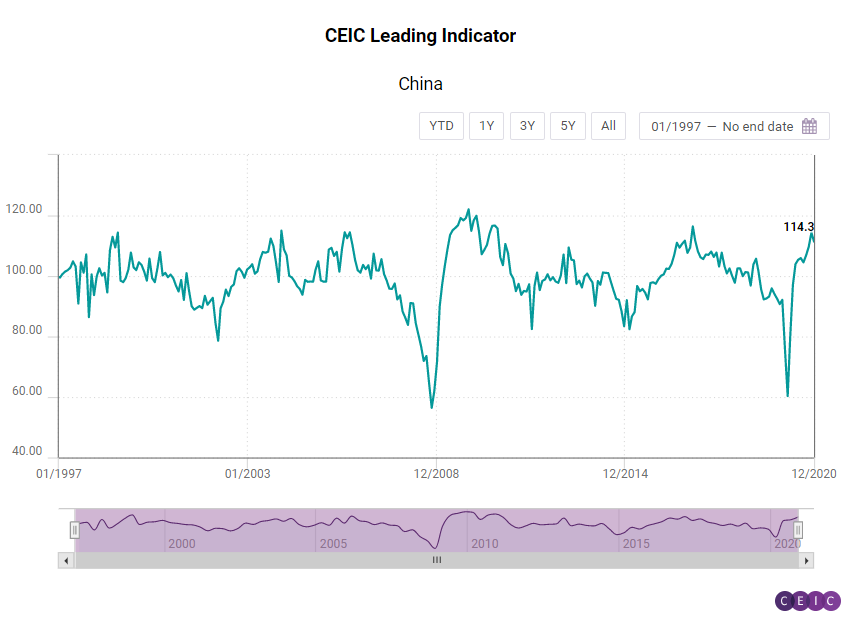
China: Heading into 2021 with Optimism
The CEIC Leading Indicator for China showed a slight moderation with the reading down from 114.33 in November to 111.39 in December. However, the indicator is still close to its highest level since early 2017 and has stayed above the 100 benchmark value for the eighth consecutive month. After a surge in November, automobile production stabilized in December with a marginal increase of 0.8% m/m. In y/y terms, it grew by 3.7%, the lowest y/y growth rate since automobile production started to recover after the hit of the pandemic. Money supply in December continued its double-digit y/y growth rate. Manufacturing confidence stood at 51.9 in December, slightly lower than November’s reading. Demand in real estate recovered gradually. Total floor space sold in 2020 increased by 2.6% compared to 2019.
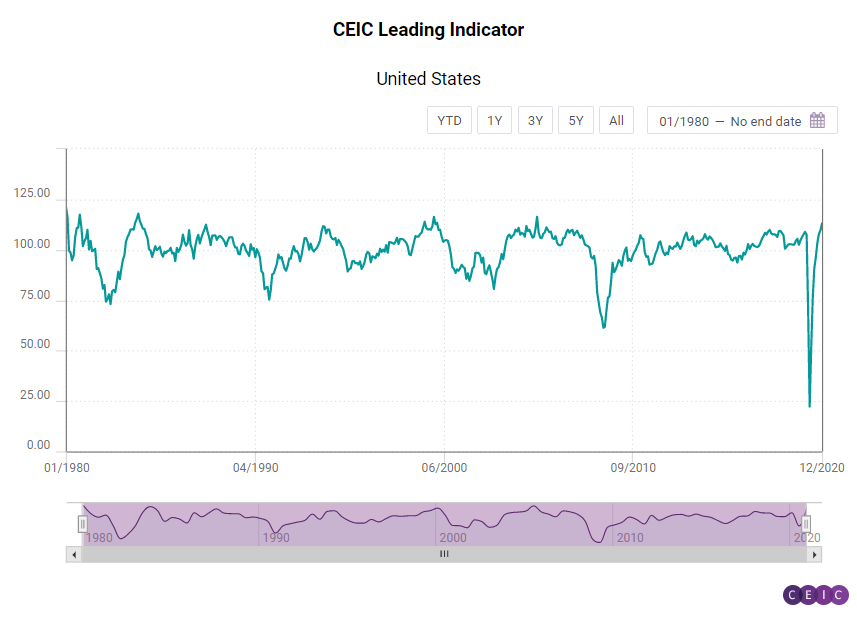
US, Euro Area and Brazil: Keeping Up the Pace
The US, Euro Area and Brazil all posted increases in the last month of 2020, with the leading indicator for the US staying at a 15-year high. The Euro Area indicator jumped above the threshold value of 100 and is even above the pre-pandemic levels. However, it is yet to reach the higher figures from 2017 and 2018. Brazil posted a more modest increase.
The CEIC Leading Indicator for the US increased for the eighth month in a row, reaching 113.12 in the last month of 2020 compared to 109.69 in November. The biggest global economy is facing a change of political leadership, along with a variety of social and economic issues, exacerbated by the pandemic. Nonetheless, the US markets seem optimistic. The S&P500 index ended the year at a record high 3,756.07 points, 16.3% higher than in 2019. The labour market seems resilient too, with the initial jobless claims per week staying at an average level of 900,000 in December. In the week ending on January 9, 2021, however, an increase was observed to 1.15mn people filing claims for unemployment benefits. Motor vehicles sales rebounded significantly to 1.65mn in December compared to 1.23mn in November. Capacity utilization rate is increasing and so is the Purchasing Managers’ Index. Consumer confidence, on the other hand, declined for the second consecutive month.
After briefly declining below 100 in November, the CEIC Leading Indicator for the Euro Area increased confidently in December to 106.46. It is supported by an improvement in the consumer confidence for the financial situation over the next year, with the indicator inching up to -3.1 pp from -5.9 pp in November. The Dow Jones Euro Stoxx index increased in December reaching 397.56 points compared to 389.72 in November. The index closed 2020 1.57% lower than 2019. The employment component of the manufacturing PMI increased to 49.2 in December compared to 48.7 in the previous month, essentially remaining in contraction territory below the 50-mark. The last time this indicator was above 50, was in April 2019.
The Brazilian economy is expected to grow moderately in Q3 2021, below the long-term trend, according to the CEIC Leading Indicator for Brazil, which anticipates the development of economic activity. The index stood at 108.85 in December 2020, higher than the neutral value of 100, but lower than the long-term smoothed indicator, which was 112.35 in the same month. Some key variables supported the performance of the raw indicator in December.
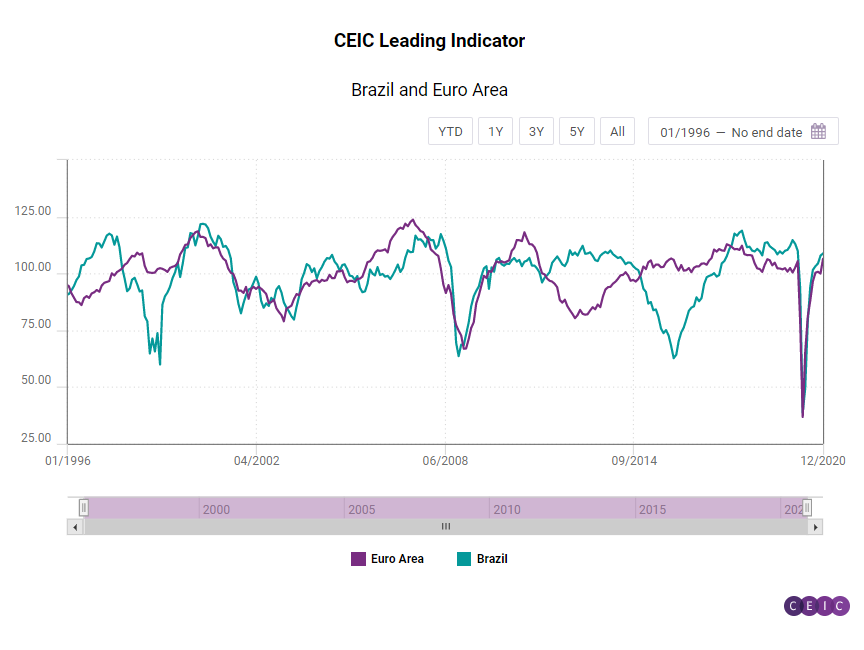
The manufacturing confidence indicator reached 14.9 in the month, a ten-year record, as many factories are stepping up production to meet the domestic demand stimulated by income transfer programmes and lower interest rates. In the construction industry, the expectation to purchase inputs index was 54.5 in the month, above the neutral value of 50, but lower than the 56.7 recorded in December 2019. On the financial markets, the equity market index jumped to 119,017 in the end of December, from 108,893 in the end of November, supported by positive news about COVID-19 vaccines. Following the same trend, the crude oil prices rose to a monthly average of USD 49.2 per barrel in December from USD 42.6 per barrel in November. Domestic demand is likely to remain heated in the medium run, according to the consumer inflation expectation indicator, which was 5.2, compared to 4.8 in November 2020 and December 2019.
Japan, India, Indonesia and Russia: Cloudy in the Land of the Rising Sun
Japan stayed on a downward trend for second consecutive month in December, while the indicators for Indonesia, India and Russia posted increases.
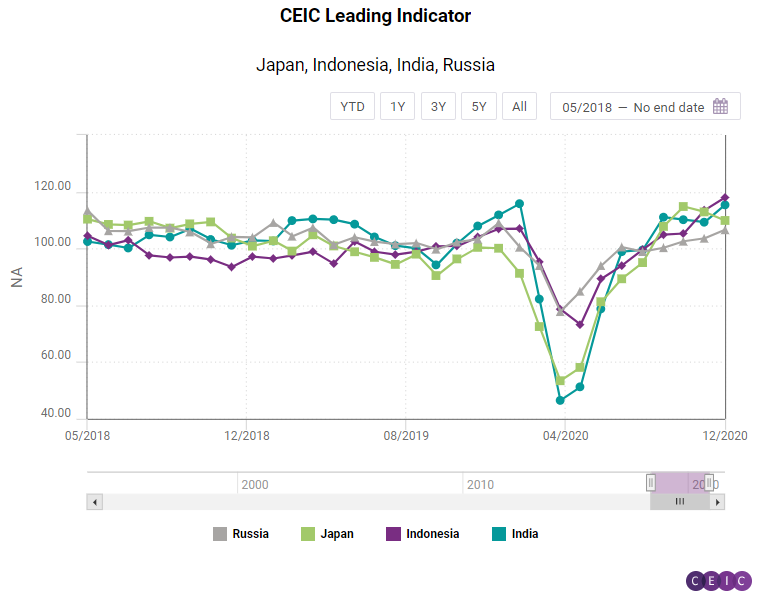
After a slight moderation in the CEIC Leading Indicator for India in November 2020, there was a considerable increase in December. The leading indicator value increased from 109.3 in November to 115.4 in December, surpassing the peak of 111.5 in September 2020. The increase in the indicator can be primarily attributed to a sustained surge in equity markets as both the Bombay Stock Exchange and the National Stock Exchanges indices attained historic highs of 47,751 and 13,981, respectively, in December. An increase in the 91-day treasury bill yield to 3.1% pa from 2.8% pa in December 2020 also reflects that investor sentiment has picked up. The M2 money supply also increased by 19.1% y/y in December 2020. Passenger vehicle sales, after a brief slowdown in November, increased by 24.2% y/y in December 2020, which also contributed to the overall increase in the leading indicator. Metal production is undergoing a slowdown, as crude steel barely accelerated by 0.01% y/y in December, and finished steel declined by 4.2% y/y. On the other hand, electricity generation increased by 4.6% y/y in the same period. The deceleration in food prices continued for the third month in a row as the wholesale price index for food grew by 0.9% y/y in December 2020.
Indonesia was the top performer in the last month of the year, with the CEIC Leading Indicator for the big ASEAN economy reaching 117.99 compared to 113.54 in November. The latest figure is the highest since the beginning of 2008. The Indonesian rupiah further appreciated against the US dollar, reflecting the continuous recovery of capital inflows. The crude palm oil price maintains its upward trajectory, started June 2020, even accelerating in the last two months of 2020 and reaching USD 924.69 per tonne. The non-oil and non-gas exports follow a similar pattern. Their value increased for a fourth month in a row, amounting to USD 15.5bn in December compared to USD 14.5bn in the previous month. Motor vehicles sales, on the other hand, remained in negative territory, declining by 34.8% y/y in December. Nonetheless the declines keep getting smaller.
The leading indicator for Russia grew to 106.59 from 103.6 in November. The indicator is yet to reach its pre-pandemic levels. In January 2020, for instance, right before the pandemic struck, it was 109.06. The last two months of 2020 were positive for the Russian market players, as the closely monitored RTS index increased both in November and December and closed the year at 1,387.46 points. Business sentiment in the manufacturing sector improved for a second month in a row. The expectations for the sales prices in the next three months got a boost too. A positive development is observed in new automobile sales as well - they increased to 166,666 units compared to 157,580 in November. The rise of the crude oil price accelerated to USD 49.17 per barrel compared to USD 42.61 a month earlier.
Japan stands out as one of the two countries experiencing a decline in the CEIC Leading Indicator. In December it stood at 109.89, decreasing for a second consecutive month. The consumer confidence among the one-person households worsens, as the corresponding indicator bucked the positive trend and declined to 34.9 compared to 36.7 in November. Similar is the sentiment among corporations, with the Economy Watchers index for the manufacturing declining for a second month in a row to 47.9. Motor vehicle sales lost momentum and decreased to 379,896 units. In November they stood at 411,601.
Keep informed each month on the predicted turning points of the economic cycle for key markets with our free, proprietary CEIC Leading Indicator. Learn more and register here