-jpg.jpeg)
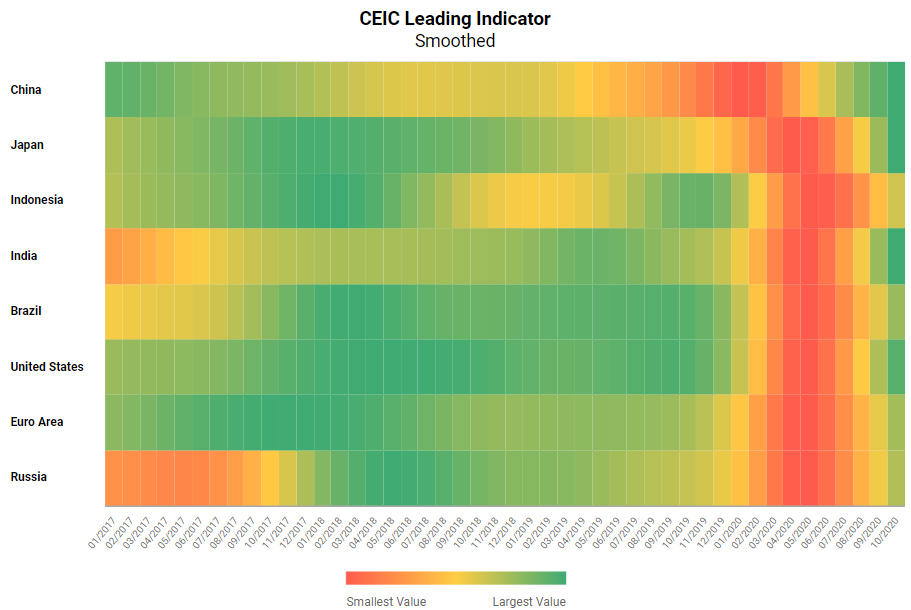
The CEIC Leading Indicator is a proprietary dataset designed by CEIC Insights to precede the development of major macroeconomic indicators and predict the turning points of the economic cycle for key markets. It is a composite indicator which is calculated by aggregating and weighting selected leading indicators covering various important sectors of the economy, such as financial markets, the monetary sector, labor market, trade and industry. It is developed through a proprietary CEIC methodology and employs data from the CEIC database. The CEIC Leading Indicator currently covers eight regions - Brazil, China, India, Indonesia, Russia, the Euro Area, Japan and the United States.
As global economies prepare for the second wave of the COVID-19 pandemic, the CEIC Leading Indicator data for October 2020 shows that almost all of the surveyed regions keep up their strong performance. China proved that the monthly decrease in August was just a minor hiccup and the leading indicator rose for a second consecutive month. The US, Japan and Indonesia indicators accelerated robustly in October, while those of the Euro Area, Brazil and Russia also grew but at a slower pace. India was the only surveyed country where the indicator decelerated on a monthly basis, although its values still remain fairly high.
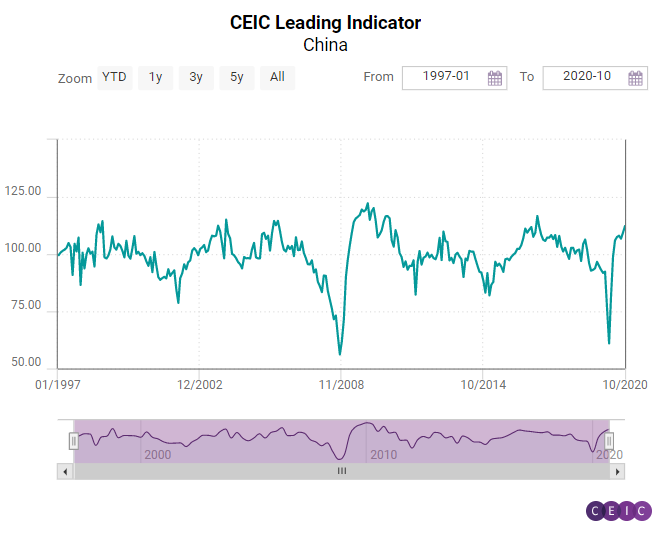
China: Pace Picking Up Again
The CEIC Leading Indicator for China was up by 2.78 from 109.48 in September to 112.26 in October, the highest level so far in 2020. After hitting a record low of 60.96 in February amid the COVID-19 epidemic, the indicator quickly bounced back and entered an expansion phase in May. October's reading was way above the pre-pandemic levels and indicated robust economic growth in China. The automobile industry maintained its strong performance. Apart from the continued recovery of domestic demand, China’s automobile exports also surged in October. After a big jump in September, automobile production stabilized in October with a marginal increase of 0.8% m/m. However, compared to the same period of last year, automobile production grew by nearly 9%. Money supply was down on a monthly basis for the first time since July, however, on an annual basis it recorded a double-digit growth of 10.5%. Manufacturing confidence stabilized as well and China’s official PMI barely changed in October. The floor space sold of commodity buildings finally recorded a positive y/y growth rate - in the first ten months of 2020, it was marginally higher than in the same period of the previous year.
US, Euro Area and Brazil: Same Direction, Different Speed
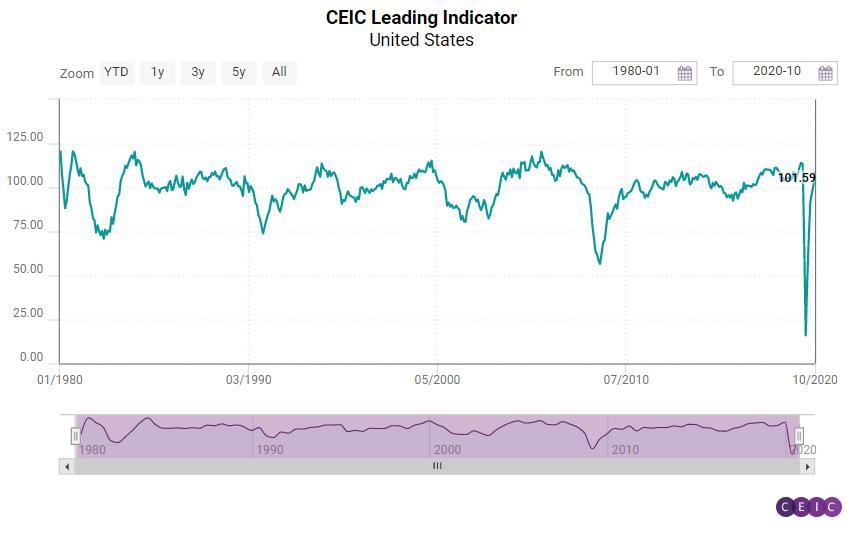
In October, the leading indicator in the three regions affected most severely by the COVID-19 pandemic – the US, the Euro Area and Brazil – continued accelerating above the threshold level of 100, with the US indicator outperforming the other two.
The CEIC Leading Indicator for the US had another strong month, rising to 109.3 in October, a monthly increase of 5.5 points. The indicator grew robustly throughout Q3 2020 and this performance was also reflected in the Q3 GDP performance of the country. October saw a sharp improvement in manufacturing, with PMI rising to 59.3, the highest reading since August 2018. Motor vehicle sales growth decelerated but remained positive on an annual basis. Capacity utilisation also improved although at a rather slow pace and a full return to pre-pandemic capacity is not expected until the end of 2020. The housing market continues to boom and the seasonally adjusted housing market index reached another record high in October, at 85.
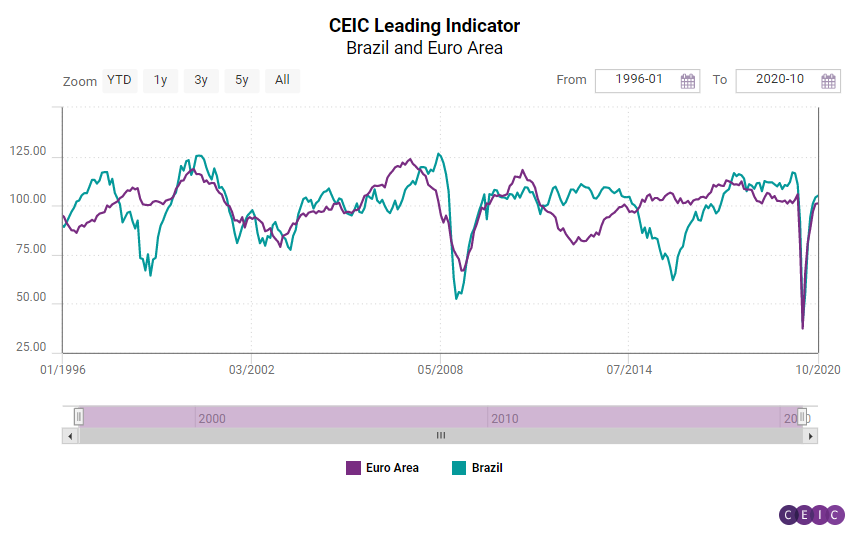
The pace of the CEIC Leading Indicator in the Euro Area was subdued in October as many eurozone member states began a second phase of pandemic lockdowns due to the rapidly increasing number of COVID-19 cases. The indicator had a minor increase of 0.2 points m/m and reached 101.1, which is still slightly below the 105.8 reading in February, before the start of the pandemic. Employment in manufacturing recorded a negligible improvement in October, while the industrial confidence indicator accelerated for a sixth month in a row and reached a value above the pre-pandemic readings. According to DG-ECFIN’s survey, eurozone consumers have downgraded the expectations for their financial situation over the next 12 months compared to their sentiment in September. A second month of decline was observed at the stock markets as the Dow Jones Euro Stoxx index fell below its May level, which should be a cause of concern for the monetary bloc.
The Brazilian economy is expected to register a significant growth in the second quarter of 2021, according to the CEIC Leading Indicator for Brazil. The indicator recorded the sixth increase in a row in October, reaching 105, higher than the benchmark value of 100, which separates a GDP acceleration prospect from a deceleration one. The robust improvement in some key indicators signals that the country’s economy is likely to grow significantly above the long-term trend in the next six to nine months. Several industries continued to rebound in October as the government’s cash transfer programmes and lower interest rates supported domestic demand. The manufacturing confidence indicator was 11.2 in the month, a nine-year record, as many local factories are accelerating production. In the construction industry, the expectation to purchase inputs indicator was 54.2 in October 2020, above the neutral value of 50, and higher than the 53 in October 2019. Crude oil prices declined to USD 40.1 per barrel in October, from USD 41.5 in September, amid uncertainties surrounding the economic recovery in the US and the EU. Following the global instability, the equity market index inched down to 93,952 in the end of October from 94,603 in the end of September.
Japan, India, Indonesia and Russia: Between Expansion and Moderation
The four economies that suffered a relatively milder shock at the beginning of the pandemic – Japan, India, Indonesia and Russia – continue to diverge on their recovery path according to the October readings of the CEIC Leading Indicator.
The CEIC Leading Indicator for Japan jumped to 116.1, one of the highest readings on record and marked the fifth month in a row of impressive leaps. This is also the highest reading among all observed regions. According to the Cabinet Office economic sentiment survey, current economic conditions in manufacturing are at the highest level since December 2017. Consumer confidence also increased for a second month in a row and is close to its pre-pandemic level. Growth in motor vehicle sales rebounded in a spectacular fashion after a whole year of annual declines, rising by 29.2% y/y.
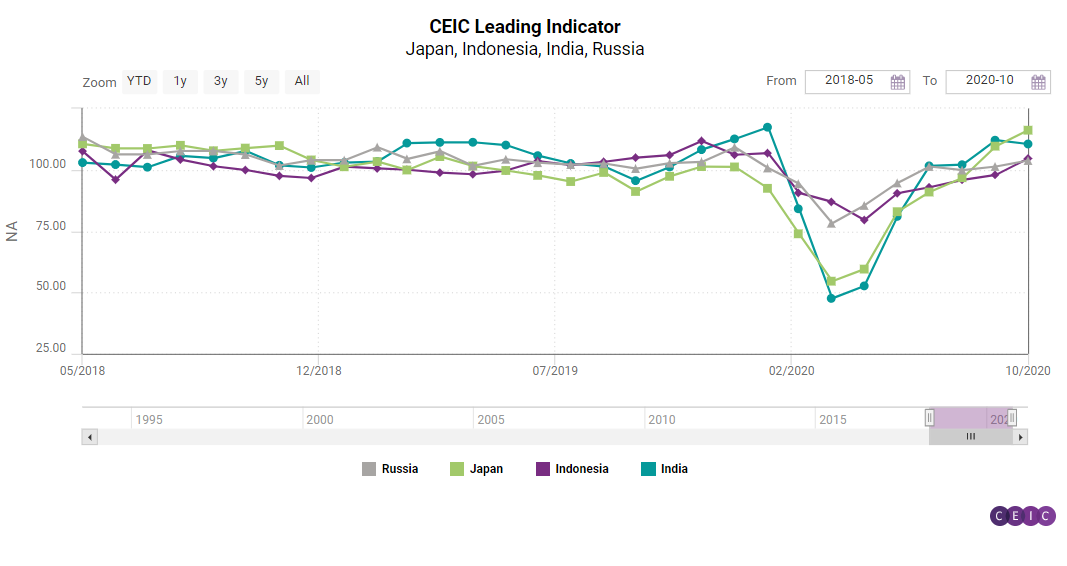
The CEIC Leading Indicator for India moderated to 110.5 in October 2020 from 112.1 in September. While the economy is recovering from the impact of the lockdown and dealing with the pandemic at the same time, many high-frequency indicators are showing moderation, reflecting the restoration of normalcy. Broadly, industrial production has witnessed an increase but there has been a slowdown in wholesale inflation and money supply. Electricity generation grew by 8.9% y/y and steel production rose by 1.1% y/y in October as opposed to increases of 4.8% y/y and 0.1% y/y, respectively, in September 2020. Crude steel production also increased by 0.2% y/y in October after declining by 2.9% y/y in September. On the other hand, money supply growth slowed down to 16.5% y/y after consistently registering increases of above 18% y/y for the previous three months. The wholesale food inflation also decelerated to 5.8% y/y in October from 6.9% y/y in September. In terms of consumer sentiment, passenger car sales sustained their upbeat trend, growing by 31.7% y/y in October after an increase of 16.2% y/y in September. This growth could be attributed to a low base effect, as well as the festive season sales.
The CEIC Leading Indicator for Indonesia performed strongly in October, rising by 6.7 points m/m to 104.6 and finally pushed above the threshold of 100. The Indonesia stock exchange index managed to make up for some of the losses from previous months, although it is still below the June reading. Crude palm oil price in October rose to its highest level since January and the median stood at USD 714.4 per tonne, 54.2% higher than in May. Non-oil exports increased solidly on a monthly basis but fell by 1.8% y/y. A similar development was observed in domestic cement consumption.
The development of the leading indicator in Russia continues to be rather steady with values hovering marginally above the threshold level of 100. New automobile sales on the domestic market returned to a moderate growth at 1.4% y/y in October. The manufacturing production tendency has remained positive for a fourth month in a row, but its reading dropped significantly compared to the previous month. Crude oil prices are on a downward path again, falling to USD 40.1 per barrel, which is a troubling sign for the export-oriented Russian economy. This development was also mirrored on the stock market as the RTS equity market index fell to its lowest level since April, completely erasing the gains in the interim period.
Keep informed each month on the predicted turning points of the economic cycle for key markets with our free, proprietary CEIC Leading Indicator. Learn more and register here