-jpg.jpeg)
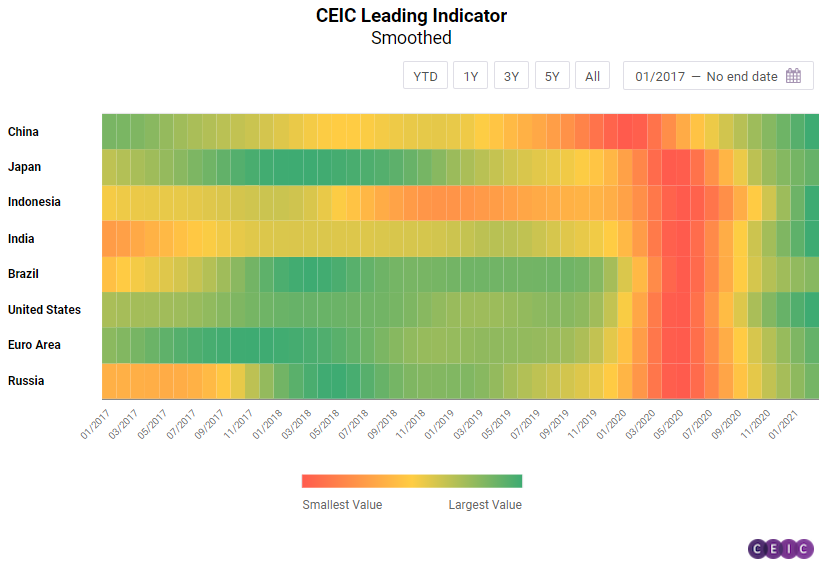
The CEIC Leading Indicator is a proprietary dataset designed by CEIC Insights to precede the development of major macroeconomic indicators and predict the turning points of the economic cycle for key markets. It is a composite indicator which is calculated by aggregating and weighting selected leading indicators covering various important sectors of the economy, such as financial markets, the monetary sector, labor market, trade and industry. It is developed through a proprietary CEIC methodology and employs data from the CEIC database. The CEIC Leading Indicator currently covers eight regions - Brazil, China, India, Indonesia, Russia, the Euro Area, Japan and the United States.
While the values of the CEIC Leading Indicator for January 2021 showed a visible moderation in the recovery pace, February data suggests that most of the surveyed countries are back on track. Economies such as the Euro Area, Russia, Japan and the US regained their pace from the end of 2020, while China, Indonesia and India built upon their continuous acceleration. The only country where deceleration is more pronounced is Brazil but the values of the CEIC Leading Indicator are still comfortably above the threshold level of 100.
China: Manufacturing Confidence Casts Shadow on China's Solid Recovery
China: Manufacturing Confidence Casts Shadow on China's Solid Recovery
The CEIC Leading Indicator for China managed to build upon its strong performance in the beginning of 2021 as it increased to 116.5 in February from 114.1 in the previous month. This is the highest reading of the indicator since March 2010, when high values were observed during the rebound phase after the 2008 global financial crisis.
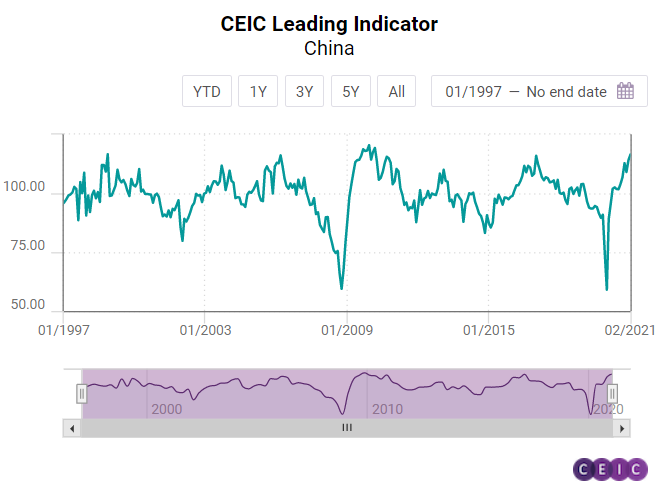
The performance of the leading indicator was backed again by accommodative monetary policy as broad M2 money supply increased by 10.1% y/y in February. Financial institution deposits rose in a similar fashion, by 10.4% y/y to RMB 217.3tn. A source of concern is the continuous decrease in the manufacturing PMI which dropped for the third month in a row, to 50.6%, and got closer to the benchmark value of 50%. Since retail sales recovered at the end of 2020, this dip in manufacturing confidence is likely due to subdued external demand, as many countries are struggling with another wave of the coronavirus epidemic. The smoothed CEIC Leading Indicator also continued its upward trend and rose to 116 in February. This performance is in line with current GDP data and major forecasts which predict a vibrant economic recovery in 2021.
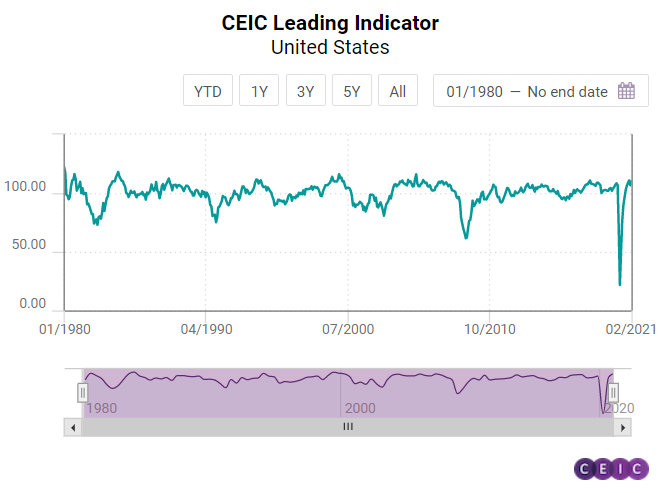
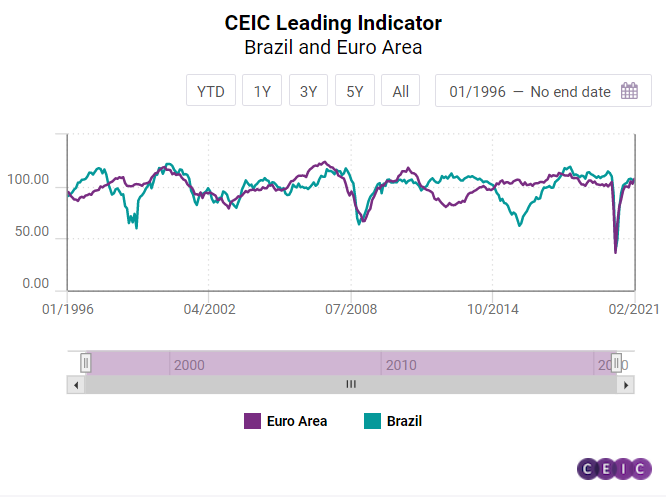
US, Euro Area and Brazil: Diverging Fortunes
While the CEIC Leading Indicator for the US and the Euro Area returned to acceleration in February, the case with Brazil is different. The country is currently experiencing a second monthly decline in a row although the values are still far from the threshold value of 100.
After its first setback in eight months in January, the CEIC Leading Indicator for the US returned to form quickly and reached 110.1 in February. The purchasing manager’s index posted its highest value since May 2004 at 60.8, suggesting a strong recovery in the manufacturing sector. On the other hand, capacity utilization declined for the first time since April, falling to 73.7%. Motor vehicle sales continued to be sluggish, dropping by 12.1% y/y. The financial markets hit another historic high in February with the S&P 500 index gaining 2.6% to reach 3,811.2. The housing market has cooled down slightly since its peak in November but the housing market index remained solid at 84.
After hovering around the threshold value of 100 in the last five months, the volatile CEIC Leading Indicator for the Euro Area finally registered a significant jump, to 107.3 in February from 102.7 in the previous month. Despite not reaching historic highs like in the US, European financial markets also had a strong month in February with the Dow Jones Euro Stoxx index gaining 6.5% compared to January. Inflation in the monetary union has been slightly rising, although it is still below 1% and thus far from ECB’s 2% target. Consumer sentiment over the situation over the next 12 months slightly improved, but it is yet to reach pre-pandemic levels.
The CEIC Leading Indicator for Brazil fell by 2.2 points to 104.2 in February 2021, as the higher inflation, the shortage of industrial inputs, and the rising number of COVID-19 cases threaten to impact the country’s economic performance in the second half of 2021. The country may post a moderate growth in Q3, as the non-smoothed index remains higher than the benchmark value of 100, but it is lower than the long-term smoothed indicator, which stood at 108.8. Some key variables supported the performance of the CEIC Leading Indicator in the second month of 2021. The manufacturing confidence indicator recorded its second fall in a row to 7.9% in February 2021, seasonally adjusted, as factories are facing supply chain bottlenecks, delays and even temporary shutdowns caused by the shortage of inputs and by the lockdowns imposed in some regions. Hence, on the automotive market, the lack of models at many dealerships pushed down the sales of new vehicles by 14.2% y/y to 186,718 units in February. In the construction industry, the expectation to purchase inputs index slipped to 55.3 from 57 in January 2021, but remained well above the neutral value of 50. The consumer inflation expectation indicator reached 5.3 in February 2021, as inflation indices accelerated in the first months of the year, reflecting mainly higher prices of fuels. International crude oil prices rose to a monthly average of USD 61.1 per barrel in the second month of 2021, from USD 54.4 per barrel in January 2021, reflecting a heated demand from China and the cold snap which reduced oil production in Texas, the US’ main oil producing state. In the stock markets, the equity market index fell to 110,035 in the end of February 2021, from 115,067 in the end of January, influenced by uncertainties regarding fiscal and political risks, after President Bolsonaro fired the CEO of the state-run oil company Petrobras, signaling a greater intervention in the company's price policy.
Japan, India, Indonesia and Russia: Good Times Ahead
Japan and Russia had a strong February that brought them back into acceleration mode although both economies are yet to reach the pace of India and Indonesia, both of which continue to chase record high values of the CEIC Leading Indicator.
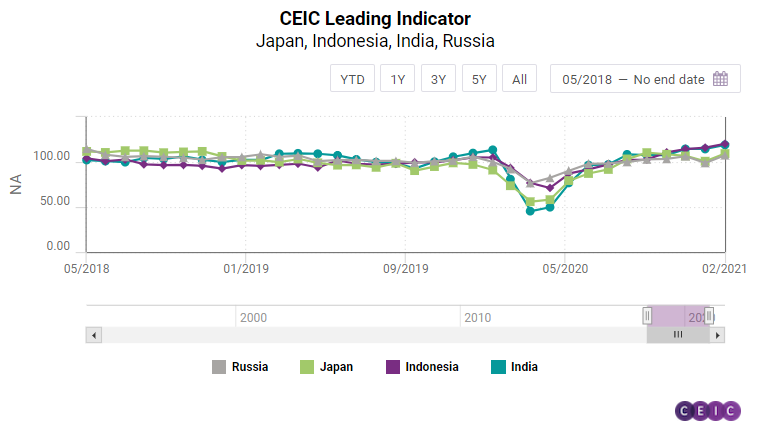
The increase in the CEIC Leading Indicator for India continued through the month of February 2021, reaching 119 from 114.4 in January. The rise in the CEIC Leading Indicator value was driven by an across-the-board increase in the underlying economic variables. Passenger car production witnessed a substantial rebound in February 2021, registering a growth of 12.8% y/y as compared to a 2.2% y/y decline in January 2021. In terms of growth in metal production, crude steel decelerated to 3.8% y/y from 7.6% y/y in January, while finished steel accelerated to 5.3% y/y from 1.1% in January. Equity indices soared further in February - the BSE Sensex average for the month crossed the 50,000 mark and closed at 49,099 on the back of a welcome budget for FY2022. Money supply growth, on the other hand, decelerated to 18.5% y/y from 19.5% y/y in January 2021, after increasing for three consecutive months. The yield of 91-day treasury bills declined once again to 3.2% p.a., and the amount outstanding saw a large expansion, from 19.3% y/y in January to 36.7% y/y in February 2021, suggestive of the preference for government bonds among investors once again. The smoothed CEIC Leading Indicator climbed further to 120.5. India’s GDP for Q4 2020 registered a growth of 0.4% y/y, bringing the economy out of the recession. The steady rise in both the actual and the smoothed CEIC Leading Indicator over the October-December 2020 period suggested this kind of recovery. For the current quarter, both indicators are trending upwards, which is in line with the expectations for an expansionary growth phase of the economy in the short term.
The CEIC Leading Indicator for Indonesia hit 120.2 in February which puts the country close to the historic peak of 122.3 prior to the Asian financial crisis of 1997 and is the best performing among the observed economies, although India seems to be closing the gap. Crude palm oil prices continued to rise, reaching USD 1,097.1 per tonne, the highest since February 2011. Non-oil and gas exports decelerated for the second month in a row but still increased by 8.7% on an annual basis. The stock markets followed global trends and the Jakarta composite index registered a monthly gain of 6.8% in February. The rupiah lost some ground against the USD and traded at IDR 14,229 per USD at the end of the month. Motor vehicle sales are still far from recovery and recorded another month of strong annual decrease, by 38.2% y/y.
After three months of continuous deceleration and touching the threshold value of 100, the CEIC Leading Indicator for Japan managed to rebound strongly in February, increasing by 8.4 points m/m to 109.3. The consumer and corporate surveys, which had both been pessimistic since Q4 2020, revealed an increase of positive sentiment. Stock markets were moderately optimistic with the TOPIX Small index increasing on a monthly basis but not being able to regain the losses since the COVID-19 pandemic began. Motor vehicle sales continued to decelerate since their peak in October 2020 and only managed to increase by 0.5% y/y. There is still a decline on an annual basis in domestic machine tool orders, by 4.8%, but the figures are rather optimistic as this is the lowest drop since November 2018.
The CEIC Leading Indicator for Russia made a remarkable comeback in February after falling below the threshold level of 100 in the previous month. The indicator increased by 8.6 points m/m to 107.6 which is also the highest value in two years. Rising oil prices continue to strongly support the Russian economy, with the OPEC spot crude oil price reaching USD 61.1 per barrel in February, the highest since January 2020. Manufacturing production tendency returned to positive values increasing to 8.1% from -5.9% in January. Domestic sales of new automobiles also increased, albeit marginally, by 0.9% y/y. The strong performance of commodity prices had a positive effect on Russian stock markets and the RTS stock exchange index gained 3.2% on a monthly basis.
Keep informed each month on the predicted turning points of the economic cycle for key markets with our free, proprietary CEIC Leading Indicator. Learn more and register here