
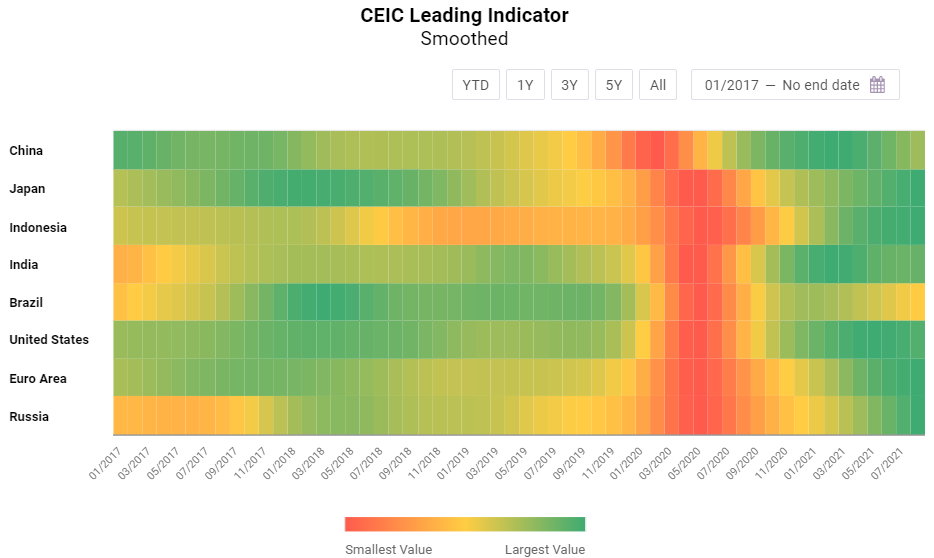
The CEIC Leading Indicator is a proprietary dataset designed by CEIC Insights to precede the development of major macroeconomic indicators and predict the turning points of the economic cycle for key markets. It is a composite leading indicator that is calculated by aggregating and weighting selected leading indicators covering various important sectors of the economy, such as financial markets, the monetary sector, labour market, trade, and industry. It is developed through a proprietary CEIC methodology and employs data from the CEIC database. The CEIC Leading Indicator currently covers eight regions – Brazil, China, India, Indonesia, Russia, the Euro Area, Japan, and the United States.
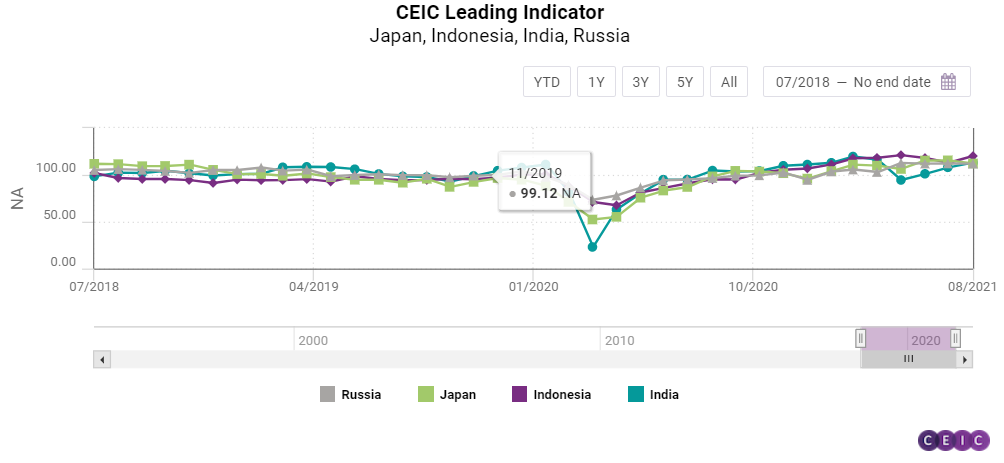
August 2021 data for the CEIC Leading Indicator reveals that the majority of the surveyed economies are still performing above their long-term average of 100 but are likely on the path of deceleration, having already surpassed the peak of their business cycles.
The notable exception is India, which managed to recover from the pandemic-related shock in May and registered an increase for the third month in a row. The smoothed CEIC Leading Indicators for the Euro Area, Russia and Japan are still growing, albeit at a slow pace, while Brazil’s economy is now firmly performing below its long-term trend.
China: Growth Outlook Worsens
The Delta variant of the coronavirus and the policy crackdown on property sales have weighed on China’s economic recovery, according to the CEIC Leading Indicator, which anticipates turning points of the business cycle. The CEIC Leading Indicator for China declined for the fifth month in a row in August, to 101.4, close to the long-term average of 100 and worsening the growth outlook for the rest of the year as well as for Q1 2022. China’s official manufacturing PMI dropped further to 50.1 in August from 50.4 in July, marking the fifth consecutive month of decline and suggesting a deterioration in the manufacturing sector, mainly due to the resurgence of COVID-19. Automobile production declined by 18.6% y/y in August as the industry continued to suffer from chip shortages.
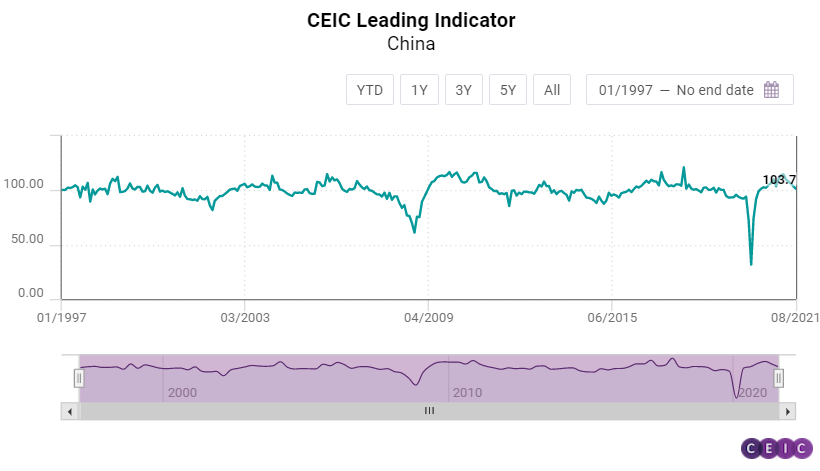
Growth of money supply decelerated, increasing by 8.2% y/y in August from 8.3% in the previous month, the slowest growth rate since April 2021. The expansion of financial institution deposits also slowed down to 8.3% y/y from 8.6% y/y in July. Affected by tighter regulations, China’s real estate sector continued to cool down, as the floor space sold of commodity buildings in the period January-August 2021 increased by 16% y/y compared to 21.5% y/y in the period January-July 2021. The smoothed CEIC Leading Indicator fell to 102.4 in August from 104.5 in July, dropping close to the threshold of 100. A value above 100 suggests that the country is still performing above the long-term average, but the economic rebound might be short-lived.
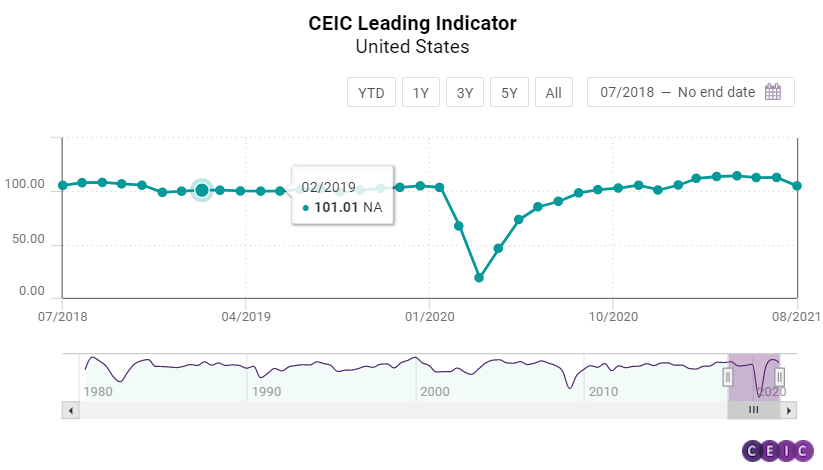
US, Euro Area, and Brazil: US Plunges, Brazil Firmly below 100
The CEIC Leading Indicator for the US dropped sharply in August, falling to 105.1 from 113 in July, the largest monthly decline since the first COVID-19 lockdown in April 2020. Consumer confidence was among the chief culprits for this development, declining by 9% m/m due to concerns related to the spreading Delta variant of the coronavirus as well as increasing prices for household goods. The automotive and real estate industries also contributed to the decline in economic activity. The number of motor vehicles sold in August was the lowest since April 2020, marking an annual decline of 16.7%. The seasonally adjusted housing market index fell from 80 in July to 75, the lowest in 13 months, signalling a normalisation in the booming real estate sector. On the other hand, manufacturing PMI increased by 0.4 points m/m in August, reaching 59.9, comfortably above the threshold level of 50, despite inflationary pressures due to raw material shortages. Capacity utilization finally reached pre-pandemic levels, standing at 76.4% in August.
In the eurozone, the business cycle has likely passed its peak as the CEIC Leading Indicator declined for the third month in a row. Nevertheless, the values for the Euro Area continue to be among the highest in the observed economies. In August, the non-smoothed CEIC Leading Indicator dropped to 114.4, compared to 114.6 in the previous month. The employment component of the manufacturing PMI decreased for the first time since April 2020, although, at 57.3, it is still close to the historic peaks and well above the threshold of 50. The Dow Jones Euro Stoxx index gained 2.6% in August compared to July and reached a record high of 470.02. In terms of industrial confidence, the growth of the basic metals in the manufacturing components decelerated to 21.1 pp from 23.5 pp in July. Conversely, consumer sentiment improved, with confidence over the financial situation in the next 12 months increasing by 1 pp compared to 0.9 pp in July.
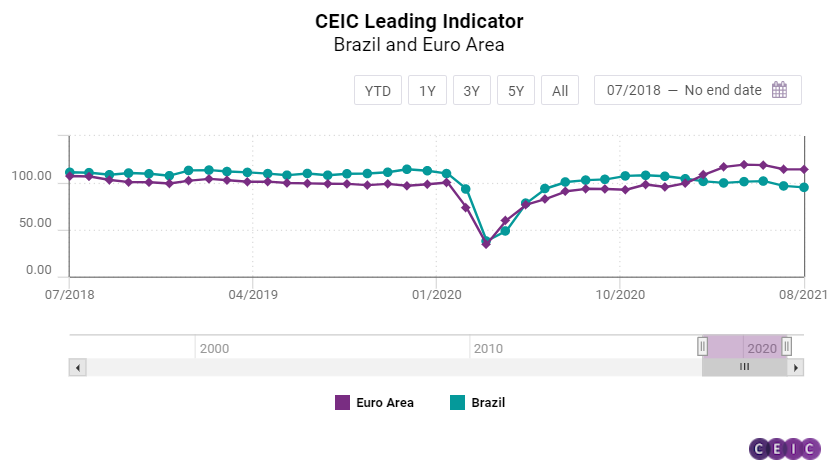
Brazil’s economic activity moderated for the second consecutive month in August 2021, according to the CEIC Leading Indicator, which anticipates turning points of the business cycle. The non-smoothed indicator fell to 96.6 in August from 98.1 in July, thus maintaining a level below the threshold of 100. This development shows that economic activity is slowing down despite the decrease in COVID-19 infections across the country since late July. The equity market index Ibovespa fell to 118,781 in August from 121,801 in the end of July. This marks the second consecutive month of decline and a total loss of 6.3% over the last two months and can be attributed to uncertainties about fuel and electricity prices in the country, and lower international prices of iron ores. Confidence in manufacturing also dropped for the first time since April 2021, falling by 1.4 pp to 7%, which can be explained by the global shortage of parts and components in the manufacturing sector and with inflationary pressures. On the other hand, confidence in the booming construction industry seems to have improved as the expectation to purchase inputs index regained most of its losses in August, jumping to 55.9 from 53.8 in the previous month. The consumer inflation expectation indicator rose for the seventh month in a row to its highest value since July 2017 – 6.9 - as Brazil is seeing an increase in prices among almost all consumer goods groups.
Japan, India, Indonesia, and Russia: A Steady Pace of Recovery for India
The CEIC Leading Indicator for Japan declined for the first time since May 2021, dropping to 112.1 in August from 115.5 in July. Sales of motor vehicles are no longer enjoying the low base effect from 2021 and declined for the second month in a row in August, by 2.1% y/y, although the drop was less pronounced compared to the 4.8% y/y in the previous month. Low base effect, however, is being observed on the domestic trade front, with the value of domestic machine tool orders increasing by 100.4% y/y in August, having grown at a double-digit rate since March 2021. Corporate sentiment in manufacturing dropped sharply to 45.9 in August from 52.6 in July and is at its lowest level since January. Consumer confidence about households’ overall livelihood also declined but more moderately – to 38.1 compared to 39 in July.
The CEIC Leading Indicator for India increased for a third consecutive month in August, rising to 113.1 from 108 in July. Electricity generation continued to be a key driver of this increase, with growth accelerating from 7.1% y/y in July to 17.1% y/y in August, despite the dissipating effects of the low base in 2020. On the other hand, the moderation in production of both crude and finished steel persisted for the fourth month in a row, inching closer to the pre-pandemic rates of growth. In addition to this, passenger vehicle production growth slowed from 52.6% y/y in July to 5% y/y in August. The exuberance in the capital markets also contributed substantially to the increase of the CEIC Leading Indicator. The Bombay Stock Exchange Sensex closed at a record high of 57,552.4, registering an increase of 49% y/y in August, the growth rate hastening in comparison to the previous month. The total amount outstanding in 91-day treasury bills declined for the first time since May 2020, by 0.7% y/y in August 2021. The cut-off yield for 3-month treasury bills also declined from 3.39% pa to 3.30% pa. In terms of inflation, the wholesale food price index eased further in August, to 3.4% y/y, from 4.5% in July. The smoothed CEIC Leading Indicator registered an increase in August to 107.8, by 0.2 points m/m, much in line with the anticipation over the previous month. Even though the increase is marginal, it reflects the steady pace of recovery, which is expected to continue through the rest of the year, in the absence of any further adverse events. The risk of a third wave looms as cases increase in certain parts of the country, but, at the same time, the containment and precautionary measures are likely to help keep up the pace of economic activity.
After two months of decline, the CEIC Leading Indicator for Indonesia made a spectacular comeback in August, rising by 7.1 points m/m to 120.1 and suggesting that the peak of the business cycle might not have passed yet. Palm oil prices have been on the rise again since June, averaging USD 1,252.7 per tonne, close to the record high in May. While the low-base effect for motor vehicle sales seems to be cooling down, growth is still robust at 25% m/m and 123.5% y/y not least due to the extension of the tax discount for motorised vehicles until December 2021. Non-oil and gas exports also increased strongly, by 63.4% y/y, driven by high commodity prices. The Jakarta composite stock exchange index closed August at 6,150.3, managing to gain 1.3% m/m but is yet to recover to its February level.
The CEIC Leading Indicator for Russia declined on a monthly basis in August, dropping to 112. However, there has been almost no movement in the indicator since May, with values keeping between 112.8 and 112. Similar to other economies, the low base effect from 2020 has worn off and domestic motor vehicle sales declined for the second month in a row, by 17% y/y in August. The same can be said about freight carried by the railway which grew by a mere 0.2% y/y and has been on a deceleration path since June. The OPEC spot crude oil price declined in August compared to July, averaging USD 70.3 per barrel which affected negatively a heavy oil exporter like Russia. On the other hand, manufacturing production tendency improved for the fourth month in a row, reaching 30.2% in August and getting close to the highest values on record. The RTS stock exchange index managed to compensate for the losses in July, standing at 1,684.2 at the end of August, a monthly increase of 3.6%.
Keep informed each month on the predicted turning points of the economic cycle for key markets with our free, proprietary CEIC Leading Indicator. Learn more and register here