-png.png)
The CEIC Leading Indicator is a proprietary dataset designed by CEIC Insights to precede the development of major macroeconomic indicators and predict the turning points of the economic cycle for key markets. It is a composite leading indicator which is calculated by aggregating and weighting selected leading indicators covering various important sectors of the economy, such as financial markets, the monetary sector, labour market, trade and industry. It is developed through a proprietary CEIC methodology and employs data from the CEIC database. The CEIC Leading Indicator currently covers eight regions – Brazil, China, India, Indonesia, Russia, the Euro Area, Japan and the United States.
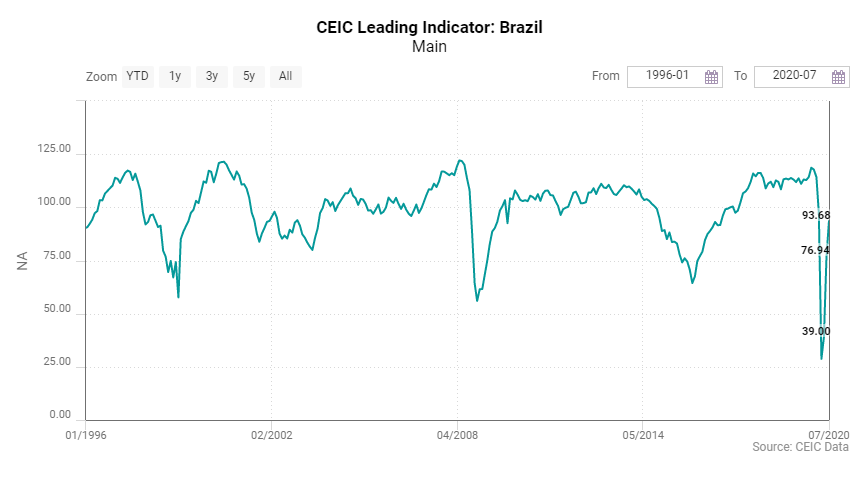
The CEIC Leading Indicator for Brazil improved for the third month in a row in July, reaching 93.7, and gеtting closer to the levels observed before the COVID-19 crisis. Despite the improvement, the indicator continues to stay below 100, which means that the country’s economy is expected to operate below the long-term trend in the coming six to nine months. The positive performance in July was supported by some key variables. Motor vehicle sales increased to 184,818 units in July, compared to 135,183 in June, as the vast majority of car stores in the country reopened. The manufacturing sector also performed better in July, as the industry’s confidence indicators climbed to -10.2, from -22.4 in June. In the construction sector, the companies foresee some stability, as the expectation to purchase raw materials improved to 49.5 in July, very close to the neutral value of 50. International crude oil prices continued to rebound, reaching USD 43.4 per barrel in July, compared to USD 37 per barrel in June. Moreover, the Sao Paulo stock exchange index reached 102,912 at the end of July, compared to 95,056 points at the end of June, and exceeded the 101,812 registered in July 2019.
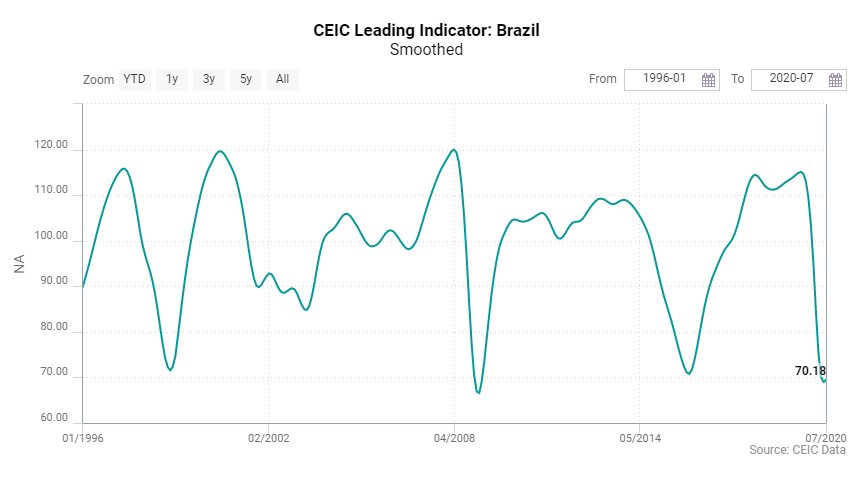
The prospect for a severe recession in 2020 remains, as the smoothed CEIC Leading Indicator remained below the neutral point of 100 for the fifth month in a row. However, the long-term negative trend was interrupted in July, as the smoothed indicator saw a slight uptick to 69.5, after falling to 68.9 in June, the lowest value in 11 years. These figures indicate that the economic activity in the first quarter of 2021 may approach stability on an annual basis, mirroring the performance of Q1 2020.
Keep informed each month on the predicted turning points of the economic cycle for key markets with our free, proprietary CEIC Leading Indicator. Learn more and register here