
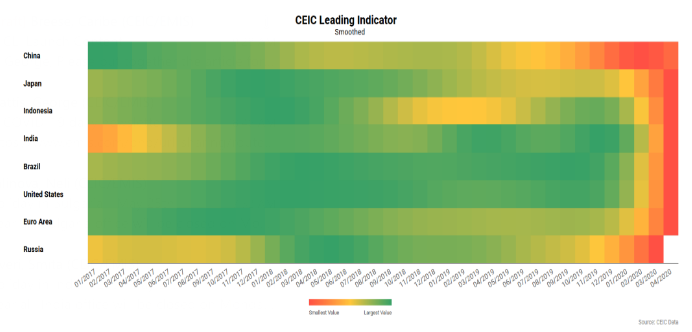
The CEIC Leading Indicator is a proprietary dataset designed by CEIC Insights to precede the development of major macroeconomic indicators and predict the turning points of the economic cycle for key markets. It is a composite leading indicator which is calculated by aggregating and weighting selected leading indicators covering various important sectors of the economy, such as financial markets, the monetary sector, labour market, trade and industry. It is developed through a proprietary CEIC methodology and employs data from the CEIC database. The CEIC Leading Indicator currently covers eight regions – Brazil, China, India, Indonesia, Russia, the Euro Area, Japan and the United States.
The CEIC Leading Indicator data in April suggests that in the next couple of months some of the major economies will be entering into a contraction even more severe than that in the first quarter of 2020. According to the data, the scale of the economic downturn caused by the COVID-19 outbreak and the worldwide lockdown has reached, and for some of the countries has far exceeded, that following the Lehman Brothers collapse.
The US, the Euro Area and Brazil will be the ones that will be suffering the deepest contraction among the eight countries/regions covered by the indicator. The damage on their real economies is predicted to be much higher compared to that in the 2008-2009 recession. In April 2020, the non-smoothed CEIC Leading Indicator for the US and the Euro Area plummeted to 15.4 (long-term trend equals 100) and 33.9, respectively, while that for Brazil slumped to 17.4, which was far below the 66.2 trough in January 2016 and the previous all-time low of 55.4 in December 2008. In contrast, the decline in the Asian countries covered by the CEIC Leading Indicator is much less severe. In Japan, India and Indonesia, even though the indicator dropped substantially in March and April, the decline was considerably softer. Moreover, the magnitude of the economic contraction has so far not exceeded the one in the 2008-2009 recession, or the one during the Asian currency crisis in 1997. In China, even though the indicator decreased sharply following the lockdown after the Spring Festival, it reached a trough in February and improved substantially in March and April.
China: Set for Strong Recovery
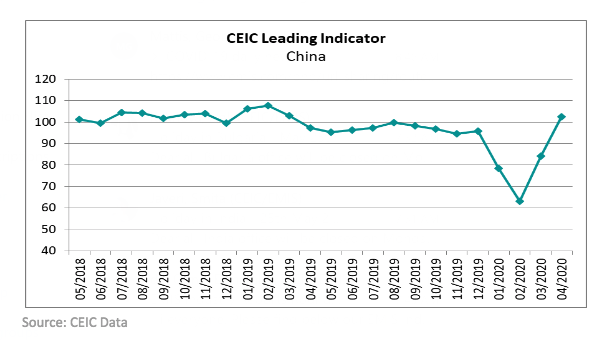
Following the first COVID-19 cases in China and the extension of the Spring Festival holidays, the CEIC Leading Indicator for China dropped to 78.5 in January and 63.2 in February from a stable level close to the economy's long-term trend over the whole 2019. The indicator's decline in January and February signalled a severe contraction of the second-largest economy in Q1 2020 and a period of high volatility over the first half of the year. The rapid decrease of the indicator in January and February was due above all to the sharp decline in the automotive and the real estate sectors. China's automotive production dropped to 284,500 units, which was the lowest monthly production in China in almost two decades. Also, in the first two months of the year the volume of floor space sold in China plummeted by 39.9% y/y. The economic sentiment in the country also contributed to the sharp decline of the CEIC Leading Indicator in January and February. The purchasing managers' index published by the National Bureau of Statistics dropped to an all-time low of 35.7 in February.
However, the indicator has managed to bounce back, increasing to 96.7 in March and 102.5 in April, which was the first time when the CEIC Leading Indicator for China exceeded its long-term trend since March 2019. And while the high April result can be explained with a low base effect due to the poor performance in the preceding months, it can be considered as a strong signal that the Chinese economy is turning to a recovery and its performance in Q2 and Q3 will be much better than that in the first quarter of the year.
US, Euro Area and Brazil: Heading for Unprecedented Slump
The CEIC Leading Indicator shows a much gloomier picture for the Western economies - the US, the Euro Area and Brazil. Since September 2019, the CEIC Leading Indicator for the US had been growing steadily above its long-term trend, underpinned by the strong performance of the stock and the property markets. Moreover, the accommodative monetary policy in the second half of 2019 offset the downward impact of the labour market on the indicator's performance. However, although the CEIC Leading Indicator remained stable above the 100 threshold in February as the stock market initially ignored COVID-19's potential negative impact on the economy, it dropped sharply in March to 65.8, which was its lowest level since 2009 and lower than in any other previous downturns in the US.
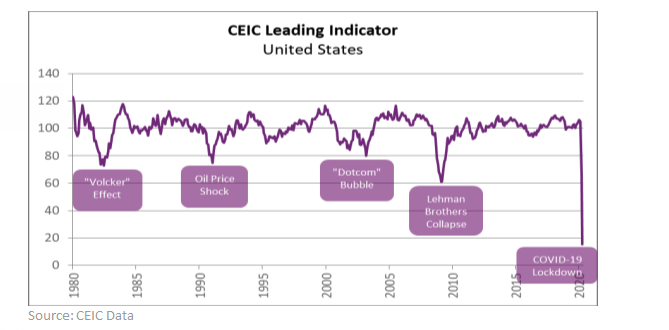
The decline in March was prompted by the historical surge in initial jobless claims, the stock market crash and the negative effect of the lockdown on the US industry, including a rapid increase in inventories and declines in capacity utilisation and auto sales. In April 2020, due to the continued deterioration of the labour market, the frozen housing market and the worsening economic sentiment the CEIC Leading Indicator sank to 15.4, which was its lowest level on record and far below its level during the 2008-2009 recession.
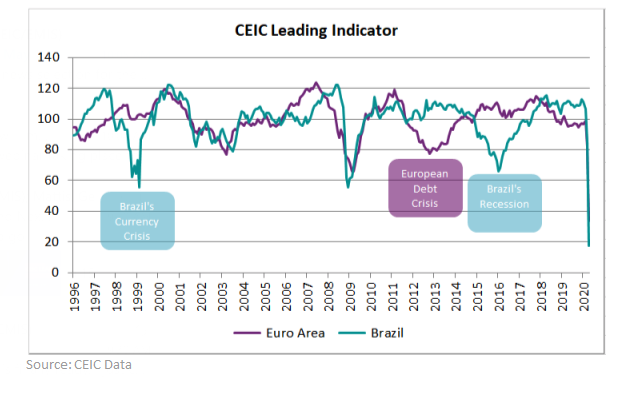
In the Euro Area, the CEIC Leading Indicator was already below its long-term trend over the whole 2019 due the poor performance of the German industry and the growing uncertainties over the Italian financial system. However, the negative impact of the real economy components on the indicator had been partially offset by the growing stock market and the accommodative monetary policy of the ECB and the indicator remained relatively stable, although in contractionary territory. The outbreak of the COVID-19 pandemic and the surge in the number of confirmed cases and deaths in the Western European countries, followed by a large-scale lockdown, caused a decline of the CEIC Leading Indicator to 80.9 in March, a level similar to that during the European Debt Crisis in 2011, but still above that during the 2008-2009 recession. However, in April the indicator dropped to an all-time low of 33.9, far below the 65.9 trough during the 2008-2009 recession.
In Brazil, the slump of the CEIC Leading Indicator in March and April came after more than two years of robust economic growth in the country. Triggered by the strong recovery of the largest Latin American economy after its worst recession on record in 2015-2016, the CEIC Leading Indicator had been above its long term trend from August 2017 to January 2020. However, although the COVID-19 pandemic had a delayed impact in the country in terms of number of confirmed cases and deaths, the commodity export-oriented Brazilian economy saw the first signals of the looming contraction in March, when the CEIC Leading Indicator dropped to 84.6, the lowest since 2016, but still above the trough of 66.2 in January 2016. In April, the indicator collapsed to an unprecedented low of 17.4. Besides the COVID-19 effect, the Brazilian economy was also strongly affected by the oil price slump. Triggered by the OPEC-Russia dispute and the global demand collapse, the Crude Oil Brent price dropped to an all-time low of USD 9.12 per barrel in April, which had a devastating impact on the oil-exporting Brazilian economy.
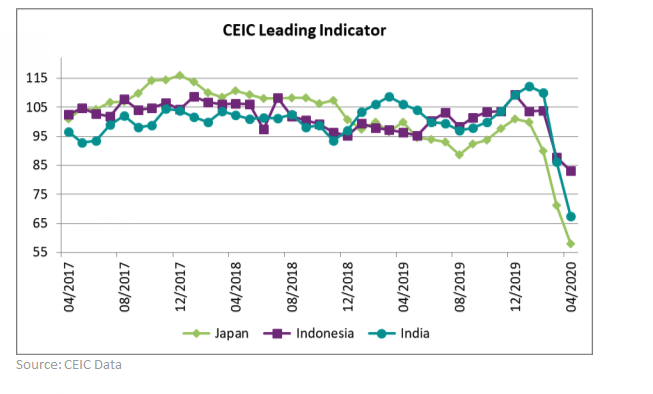
Japan, India and Indonesia: Faring Better
In contrast to their Western counterparts, the magnitude of the economic slump in the other three major Asian economies - India, Indonesia and Japan - is expected to be less severe, as anticipated by the CEIC Leading Indicator development. Japan was among the earliest impacted economies by the COVID-19 pandemic as the CEIC Leading Indicator for this country decreased to 89.9 in February, after four consecutive months of stable growth. In March and April, the indicator continued to decline, reaching 57.9 in April, a level close to the 57.1 trough in 2009. In India, after an expansionary period that started in August 2019, the CEIC Leading Indicator dropped to 86.3 in March and 67.6 in April, a level similar to that in 2009.
In Indonesia, the indicator remained at a stable level since February 2020 after a strong performance in 2019, driven by strong investment and domestic demand that offset the capital outflow from the country. In March, the CEIC Leading Indicator dropped to 87.8 due to the negative impact of the COVID-19 pandemic and the commodity price collapse. However, unlike the other countries for which the indicator fell to near-2009 crisis levels, or even lower for the Western countries, the CEIC Leading Indicator for Indonesia decreased to 83.1, which was above the 82.2 low in 2018 and much higher than the 63.1 trough in 2009 and 60.9 in 1998. The better performance of the indicator for Indonesia in April compared to the other Asian countries can be explained with the external effect of the recovery of the Chinese economy as China is Indonesia's largest export destination, accounting for more than 15% of the non-energy exports.
Keep informed each month on the predicted turning points of the economic cycle for key markets with our free, proprietary CEIC Leading Indicator. Learn more and register here