CEICData.com © 2018 Copyright All Rights Reserved
.png?width=1070&height=366&name=Brazilian%20trade%20with%20its%20main%20partners%20China%20at%20the%20forefront%20(1).png)
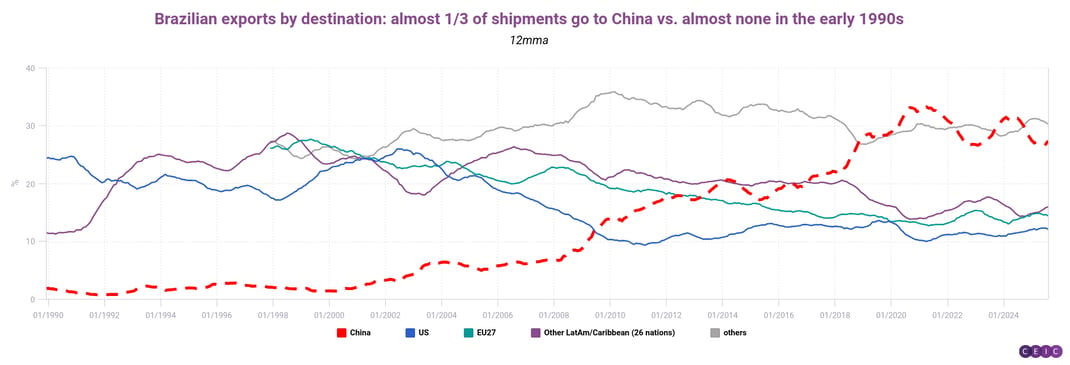
China has profoundly reshaped Brazil's economic landscape. The two nations' bilateral trade relationship soared from USD 3.2 billion in 2001 to USD 158 billion in 2024 -- a near-50-fold increase that has made China Brazil's No. 1 trading partner, eclipsing the US and the European Union even before Donald Trump's first tariff disruptions.
We've previously written about Brazil's dominance of soybean exports, but China is also hungry for the output of the South American giant's mines, ranches and forests. Meanwhile, Brazil is buying ever more Chinese manufactured goods, especially mechanical and electrical equipment -- and, increasingly, electric vehicles.
Our first chart captures a couple of inflection points. In absolute dollar terms, China had caught up with the US as a Brazilian trade partner by 2010; from about 2018, it surpassed the entire EU.
Our second and third charts focus on Brazil's exports to China. Over 90% of these shipments consist of primary commodities such as soybeans, mineral fuels, wood pulp, meat and ores.

The latter two categories have seen the most relative growth since 2016. Often, Chinese investment has funded these commodity projects.

Turning to shipments in the other direction, we can see the prominence of high-value-added Chinese manufactured goods and the growing role of vehicles in our fourth and fifth charts. This highlights another phenomenon that has some Brazilian policymakers concerned: the seeming de-industrialization of Brazil as local manufactured goods are displaced by Chinese imports, making the economy more reliant on volatile commodities. Comparing the two sides of the relationship, China's share of Brazilian imports in various categories has kept growing, even as China's share of Brazilian exports broadly leveled off from 2018.

Finally, we examine the "trade diversion effect" linked to Donald Trump's tariffs on China in 2018. Brazil was the beneficiary: after China imposed reciprocal tariffs on US agricultural products, Brazil gained share. Some 70% of Brazil's oilseeds and grain exports now flow to the Chinese market.
If you are a CEIC user, access the story here.
If you are not a CEIC client, explore how we can assist you in generating alpha by registering for a trial of our product: https://hubs.la/Q02f5lQh0